USD/INR – Weekly Outlook & Analysis for 25th March 2021
USDINR Forecast & Technical Analysis for Forex
Introduction
On India forex platforms, we can see that the Indian Rupee has made a considerable gain against the U.S. dollar in the emerging market. Can the USDINR pair continue its recent trend against the U.S. currency as the Indian government tries to stabilize its economy?
The recent tumble of the oil price and global equity will have its ripple effect on the market due to the recent lockdown in Euro amid the third wave of the coronavirus pandemic and the sanctions on China curbed risk appetite worldwide.
India’s Fundamentals
The online broker will be following the Reserve bank of Indian’s decision concerning the benchmark for rates are fixed, and the Indian government surprised announcement of a massive budget worth over 9.4% of the fiscal 2021 GDP, thereby attracting investors to its economy.
The Reserve Bank of India left its benchmark rate at 4% as of its last meeting in February to support the economy hit by the covid19 crisis and check inflation within a specific target.
The Reserve Bank of Indian reviewed its inflation forecast from 5.2% to 5% in H1 2021-2022 and 4.3% for Q3 2021-2021. The GDP growth projection is 10.5% for 2021-2022 in the range of 26.2% to 8.3% and 6% by Q3.
The 3.35% borrowing rate of repo remains the same while the marginal standing facility (MSF) rate and banks rate is at 4.25%.
U.S. Fundamentals
China melted out a retaliation of sanctions on the U.S., Europe, and Britain will affect the market conditions in terms of the trade war and other diplomatic relations. In response, China decided to cut off the weight of the U.S. dollar in a critical currency index basket, which will allow its currency to have a higher value against other peers this year.
Jobless Claims
This result indicates the numbers of individuals who officially file in for unemployment insurance for the first time in a new week.
The level of unemployment is a yardstick for those steering the country’s monetary policy to compare consumer spending and the labor market conditions.
If the actual result is lower than the forecast, it is suitable for the U.S. dollar, but a higher figure will mean a bearish move for the currency. The forecast is 720 K while the previous is 770K
USDINR Technical Analysis
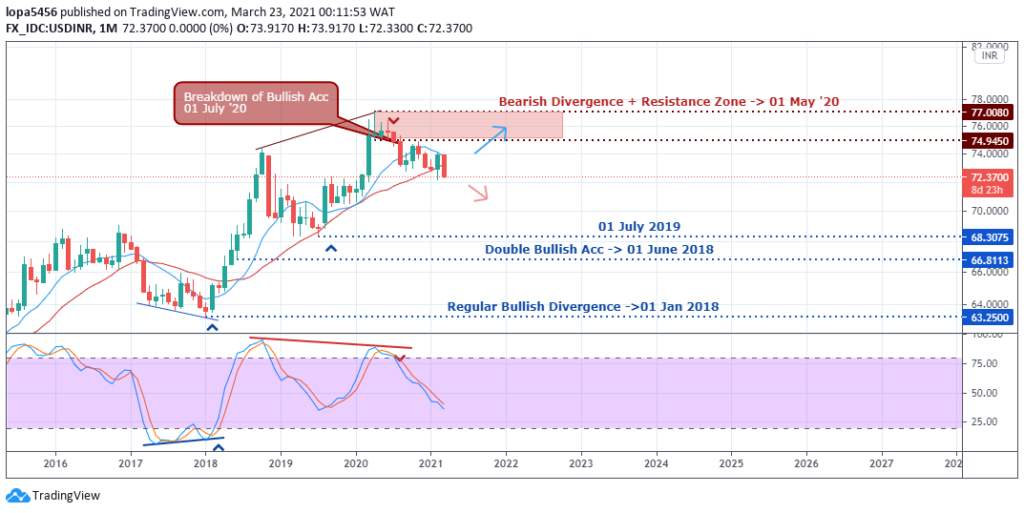
Monthly Chart Projection: Bullish Correcting

Monthly Resistance Levels: 77.45, 74.65
Monthly Support Levels: 72.65
The recent worries about possible outdated information included in the AstraZeneca Plc AZN vaccine developed with Oxford University could affect the time and pace of recovery from the pandemic, as the U.S. health agency calls for caution. This news can cause online brokers and investors to be skeptical about the state of the currency.
However, the USDNIR pair has been bearish since the coronavirus pandemic began in March 2020. The Bearish rally may likely reach the support level of 68.3075 if it can close below the 72.65 zones.
Weekly Chart

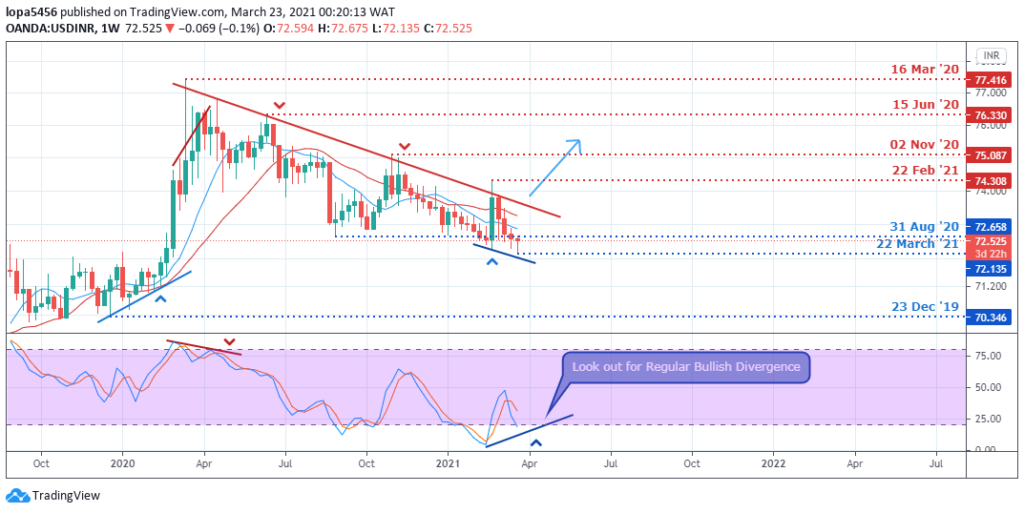
Weekly Resistance Levels: 75.478, 77.401, 74.459
Weekly Support Levels: 72.066, 72.658, 70.346
The weekly trend line has been respected by price; anytime it touches the trendline, there is a rejection of the price, indicating a strong bearish trend. A breakout above the line would mean a possible reversal of the downtrend for an uptrend.
A regular bullish divergence is building on the stochastic indicator shown on the weekly timeframe. If the support level of 72.658 can hold to reject the bear’s run, we may see the price rise towards the 77.401 resistance zone.
If the bears’ rally is strong, it can close below the 72.658 level for another swing to the support level of 70.346.
Daily Projections: Bearish-consolidating

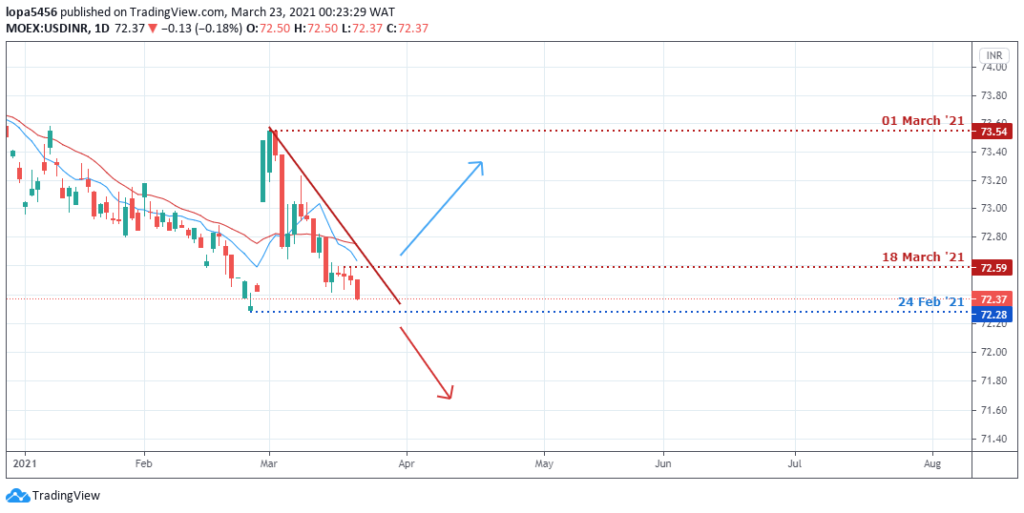
Daily Resistance Levels: 74.216, 75.087, 73.802, 72.59
Daily Support Levels: 72.2870
The daily candles show the bearish momentum in the market as they are bigger and longer than the bullish candles, which are smaller.
A close below the support zone of 72.2870 will take the USD vs. Indian Rupee lower, but a bounce from the area with a close above the 72.59 resistance zone will take the price higher to the high of 73.802 resistance level.
Bullish Scenario:
A bullish scenario buildup on the weekly time frame is not yet confirmed, but it could be a potential move if the support level of 72.658 should reject the bearish rally for a reversal.
Bearish Scenario:
The trend of USDNIR has been bearish for a while. We expect the trend to continue on the daily timeframe if we can get a close below the 72.28 support zone for the price to drop lower.
Conclusion and Projection
Most of the emerging market currencies will likely continue their gains against the weakened U.S. dollar as they hope for a higher yield in anticipation of a successful coronavirus vaccine distribution to help drive growth.
Online broker hopes that the administration of Joe Biden will end the war of tariff in the international trade matched with vaccine deployment.
The bearish momentum has not reduced as the price faces a possible bounce from the support level on the daily time frame; we may see a trend reversal in the coming days if the bear’s move should fail.

No Comments found