USD/INR – Weekly Outlook & Analysis for 4th March 2021
USDINR Forecast & Technical Analysis for Forex
Introduction
The Indian Rupee gained about 5.83% against the US dollar amid the coronavirus pandemic. India forex traders and investors would be looking out for volatile price movements on forex platforms as more stimulus packages are released into the market.
India’s Fundamentals
The Indian Rupee has made good gains above 10% in tech spending due to “stay-at-home” like that of China also.
More liquidity is expected in the market as government stimulus plans are announced to boost retail interest. The monetary policy by the Indian central bank will continue to support the Indian rupee amid stubborn inflation and emerging market currencies.
US Fundamentals
Job creation is a fundamental indication of the health of the economy of the country. The latest stimulus package signed by the President of America will likely help the country’s recovery process.
Non-Farm Payrolls
Excluding the farming industries, changes in numbers of people employed are considered by the Bureau of Labor statistics to be released during the first Friday of every month. If the data released is higher than forecast, it is suitable for the US dollar, but lower data will affect the US dollar.
The previous data was 49K, while the forecast is 185K.
USDINR Technical Analysis
Monthly Chart Projection: Bullish Correcting
Monthly Resistance Levels: 77.45, 74.65, 77.00880, 74.9450.

Monthly Support Levels: 72.65, 68, 3075
The USDINR pair met resistance at the 77.0080 levels as of May 01, 2020, which led to a correction of the bullish trend on the monthly time frame. This correction may lead to a trend reversal if the price fails to close above the high of 77.0080.
If the level of 74.9450 should hold in the coming months, the USDINR pair is likely to swing lower to the support zones of 68.3075 of July 01, 2019.
Weekly Chart
Weekly Resistance Levels: 75.478, 77.401, 74.459, 74.308
Weekly Support Levels: 72.066, 72.658, 70.346, 72.276, 70.346

From the weekly chart, you can see that the USDINR pair respects the strong bearish trend line anytime the price reaches the line. This market condition indicates that the sellers are presently in control of the market, having created lower resistances and lower lows.
If the bears can move the price lower than the support zones of 72.882 and 72.276, we shall see another bearish swing to the low of 70.346 in the coming weeks.
If the Bulls rally can close above the bearish trend line and holding the support level of 72.276 in the coming weeks, it shows that the buyers have taken over the market from the sellers with a close above the resistance zone 74.308.
Daily Projections: Bearish-Whipsaw
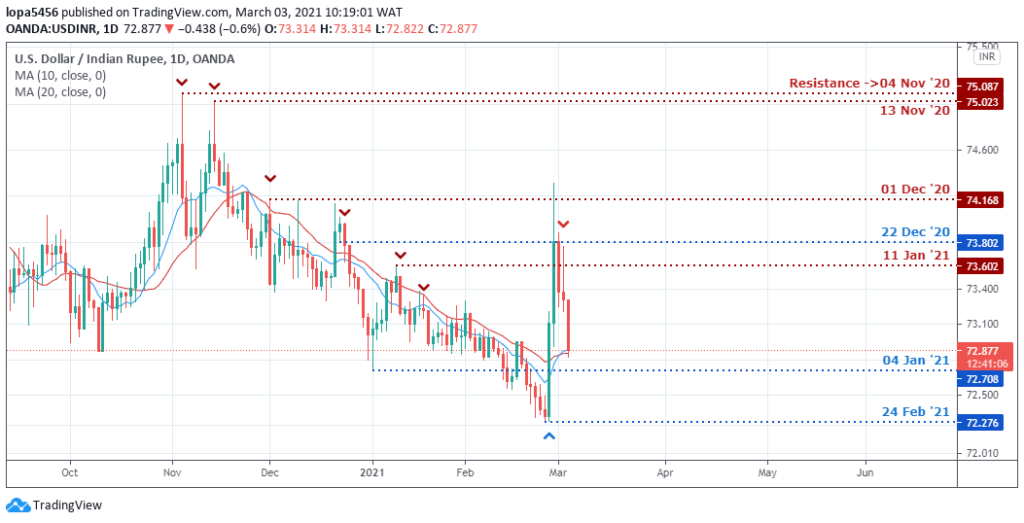
Daily Resistance Levels: 74.216, 75.087, 73.802
Daily Support Levels: 72.870, 72,708, 72.276
The bullish surge from the daily time frame indicated that some long position traders had an open position due to the positive indications of the US feed news and the possible impact of the stimulus package in the coming days.
If the support zone of 72.708 and 72.276 can hold, we will likely see more buyers open a long position for another swing targeting the 75.087 levels, having seen price pass through the 73.00 and 74.00 levels.
However, if the sellers can close lower than the 72.276 levels, the bearish trend would continue, and the bullish surge was a fake move taking out the online traders in the right direction.
Bullish Scenario:
From the daily chart, a possible bullish buildup can occur as the price retest the (72.276) zones for another swing to the upside. This weeks’ fundamentals may also likely determine the direction of the USDINR pair when the Non-Farm Employment Change data is released.
Bearish Scenario:
The recent trend has been bearish from the weekly time frame despite the upward spike respecting the bearish trend line, which is visible across online broker terminals. A close below the 72.658 support zone would push the pair lower to another low of 70.346
Conclusion and Projection
Can the bulls continue their bullish run on the monthly time frame? Should we get a stronghold on the weekly support of 72.658 to surge higher?
Or we may see the Indian rupee extend its gains against the US dollar as we await more news in the coming days and interventions of the central banks in the market or take other steps to cap appreciation.

No Comments found