USD to INR – Weekly Outlook ( October 25, 2018 )
Weekly Forecast for Indian Rupee
Introduction
The Indian Rupee is experiencing growth as the India 50 stocks show technical signs of price recovery. Despite establishing a new low of 10093.5 the IN50USD still closed bullish. Read on for more insights, events and technical setups of this week.
India’s Fundamentals
India 50 2hour Charts

After triggering a bearish engulfing pattern on the 17th October 03:00, the price of the IN50USD plummets further as further signs of bearish sentiments increased. A double bearish accumulation price action pattern triggered on the 19th October, established a strong resistance at 10347.3, leading to another 2.41% decline in price.
Not too long after that, a bullish regular accumulation pattern was recently formed on the 23rd of October changing the entire mood of the market towards bullish sentiments.
U.S dollar News
U.S. Retail Sales
The United States retail sale is a leading indicator for consumer spending. The actual result of 0.1% which was released on October 15 was way lower than the forecast of 0.7%, a huge shocker. This indicates bearish sentiment for the U.S dollar, and consequently a bearish trend for the USDINR.
Technical Analysis
USDINR Monthly Chart
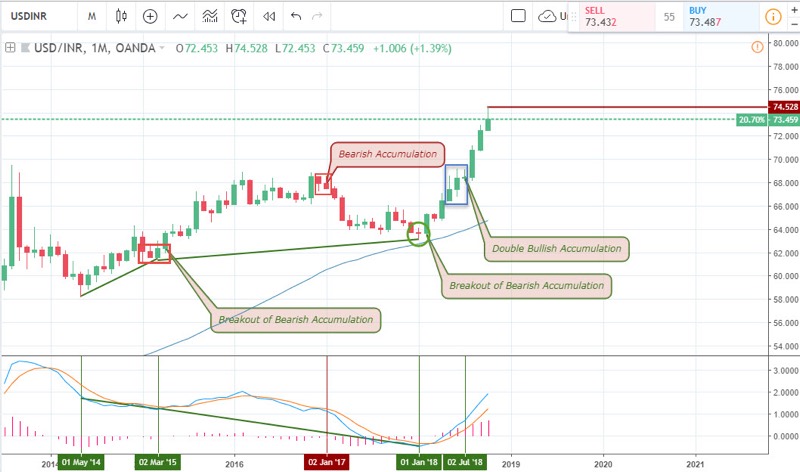
Other than the established high of 74.528, the monthly chart has not yet signalled any reversal or major continuation pattern. The pair maintains a consecutive rising bullish trend through bullish candles. The double bullish candle formed on the 2nd of July offered a long buy trade which has led to 8.89% gain from the signal, compared to a 2.27% risk exposure.
USDINR Weekly Chart
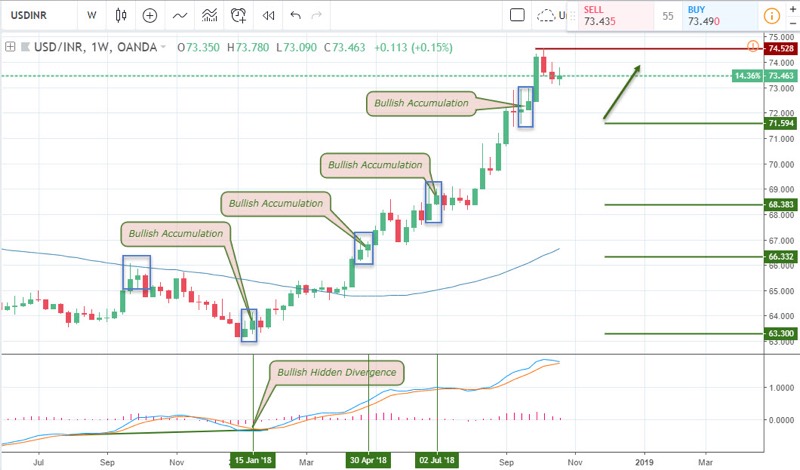
As the monthly chart showed consecutive bullish bars, the weekly chart aligns with the monthly chart as it triggered bullish accumulation patterns on January 15, April 30, July 02, and September 24. Strong support levels were established by the pair as follows: 63.30, 66.32, 68.383, 71.594 respectively. Since the formation of these setups, the price has not closed below any of the support levels as a confirmation of the strength of the bullish trend.
From the combination of Bullish regular divergence and bullish accumulation patterns formed on January 15, the price has moved by 16.67%, compared to a 1.27% risk. The most recent bullish accumulation pattern on September 24 made a rise of 2.84%, compared to a 1.16% risk.
USDINR Daily Chart: Bullish Divergence
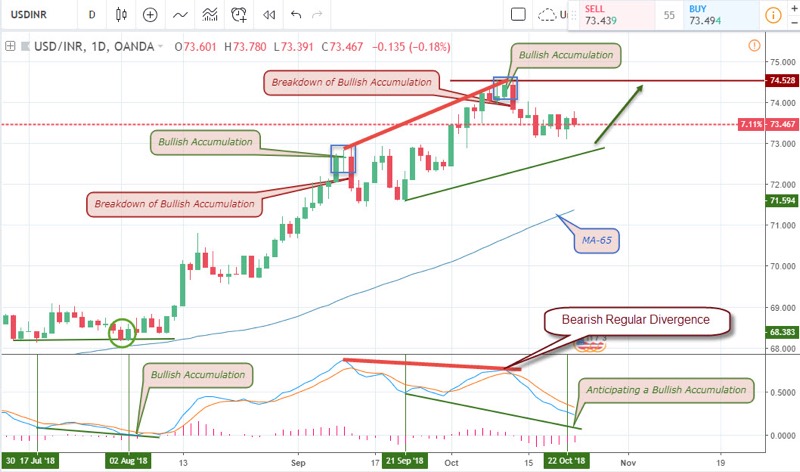
The daily chart illustrates how the exchange rate of USD to INR peaked by triggering a breakdown of the bullish accumulation pattern formed on October 11. Not to forget the bearish regular divergence pattern formed at the same time the bearish breakdown took place.
4-Hour (H4) Time Frame
October 18 was the date the 4-hour chart triggered its bearish accumulation pattern that led to the current short-term bearish trend. There’s been attempts for the pair to recover from the bearish trend as the pair later triggered a bullish regular divergence pattern on the 22nd October.
2-Hour Time Frame
Starting from October 11, where a bearish accumulation pattern was formed, price rice resumed a bearish trend as major India brokers short the pair. Patterns formed are a breakdown of bullish accumulation, bearish hidden divergence pattern and a bullish regular divergence pattern. Of all these patterns, the price breakdown of the bullish accumulation pattern on October 18 is a primary focus on the 2-hour chart which leads to a continuation of the bearish bars.
Projection and Conclusion
From the bearish regular divergence pattern formed on the daily chart, we do not expect the move to give a risk to reward ratio more than 1:1, of which the pair has already dropped 1.18% compared to a risk of 1.08%.
A bullish hidden divergence pattern is anticipated and the price is expected to make another bullish swing upon a golden crossover of the MACD oscillator or a corresponding price pattern.
Top 3 India Forex Brokers to trade Indian Rupee.


No Comments found