USD to INR – Weekly Outlook ( November 10 2018 )
Weekly Forecast: USD to INR
Introduction
The month of November opened with the USDINR making a 2.7% price decline. Read on as we analyze the technical and fundamental events and how they affect the exchange rate of the USD to INR.
India’s Fundamentals
India 50 4-Hour Charts

The India 50 share price closed lower on Friday following a decline in the Metals, Tech, and IT sectors. At the close of day, the India50 decline by 0.48%. From the above 4-hour chart, price formed a bearish regular divergence pattern on November 7 and later a bearish accumulation pattern on November 9.
India 50 Daily Charts
The above daily chart shows how the pair started off with a bearish regular divergence pattern on August 25, forming a confluence of events with bearish accumulation. As a confirmation of the bearish trend, price broke below a bullish accumulation pattern on September10, further reinforcing the bearish trend.
As the bearish trend winds down to a close, price triggered an opposite bullish regular divergence pattern that sends the pair rising higher at the moment. Similar to the bearish trend, this bullish regular divergence pattern also formed a confluence of events by triggering a bullish accumulation pattern at the same time as the divergence pattern.
Technical Analysis
USDINR Monthly Chart
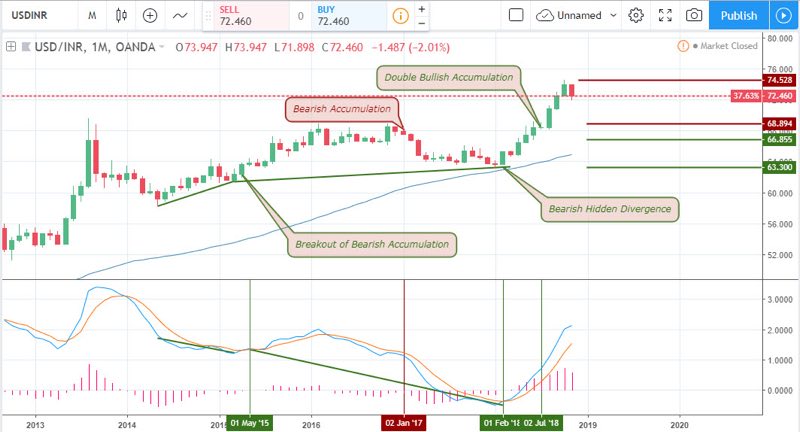
From our previous posts, we’ve already talked about the divergence patterns in May 2015, and February 2018. As the new month opened, the price began a bearish decline of about 2.64%.
USDINR Weekly Chart
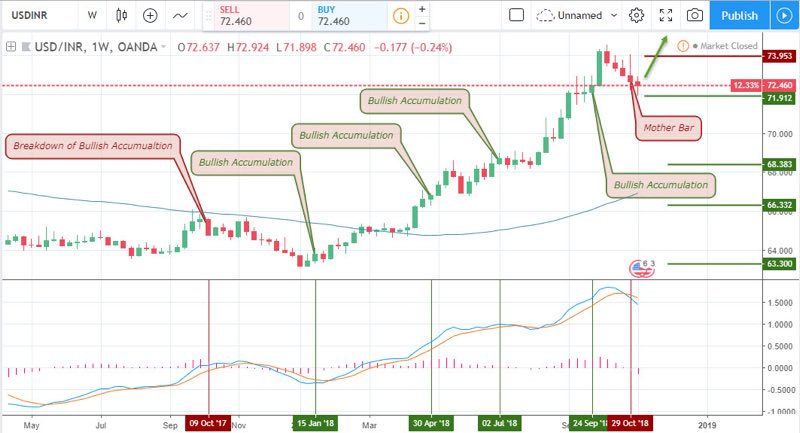
Last week closed bearish triggering a bearish accumulation pattern. Short-selling this pattern at this level is quite risky, considering that it’s formed away from the resistance level. A way to go about it is to enter a position with a low percentage risk exposure. At a bullish price close above the accumulation resistance bar, we switch to a buy order.
USDINR Daily Chart: Bullish Divergence
As shown on the above daily chart, on the 11th of October, the pair triggered a bearish regular divergence pattern, coinciding with a breakdown bullish accumulation. An attempt to send price back up was initiated through a bullish hidden divergence pattern, which later collapsed by a bearish price close below the trend line. As price trades lower, another bullish accumulation pattern failed to cause the price to shoot towards the 65-period moving average support on November 7.
4-Hour (H4) Time Frame
For a shorter term glimpse on how the next week will play out, we take to the 4-hour chart. As shown above, the pair triggers a bullish regular divergence pattern, a signal that indicates the future weakness of the Indian Rupees. Should price close above the 65-period moving average, we should expect to see a further bullish rally of the pair
2-Hour Time Frame
The above 2-hour chart also shows a similar bullish divergence pattern as the 4-hour chart. A counter bearish hidden divergence pattern was triggered to resume a continuation of the bearish trend; however, this failed to a golden cross of the MACD oscillator.
Projection and Conclusion
This week close with a bearish outlook; however, the bullish regular divergence patterns formed on the 4-hour chart, as well as the failure of bearish hidden divergence pattern on the 2-hour chart, both indicate a resumption of the bullish trend. With that said, we make a projection of the USDINR pair to complete a 1.5% rally from the bullish accumulation trigger price. Considering the mentioned profit target and a 0.42% price drop, we are looking at a risk to reward ratio of about 3.55.
Visit the broker section of our site for a list of recommended India brokers that are regulated, and offer great trading platforms for you to carry out your trade operations.

No Comments found