USDINR – Weekly Outlook for Indian Rupee February 15 2018
USDINR : Weekly Technical Analysis for Forex Brokers
Introduction
From October 08 to December 31 last year, the USDINR entered into a bearish trend in favor of the Indian Rupee. Moving forward into the New Year, the USD started a bullish campaign which is currently sustained at the moment. Read on as we analyze the fundamental and technical event that has brought the exchange rate this far.
India’s Fundamentals
India50:IN50USD Weekly Chart
On November ’18, the India50 triggers a bullish hidden divergence on the weekly time frame. This pattern corresponds with a bullish engulfing and bullish accumulation on the very date. As the IN50 trades rides the moving average as support, a breakdown of bullish accumulation is anticipated.
United States Fundamentals
U.S Consumer Price Index
One of the key indicators of foreign exchange is inflation, and the Consumer Price Index is an indicator that shows the growth rate of inflation. It is a major driver of monetary policies, of which a growth rate in excess of the forecast is positive for the U.S dollar.
Technical Analysis
USDINR: Monthly Chart

Following an increase in volatility on November ’18, the formation of a bearish engulfing pattern indicated a sound Indian Rupee. This pattern corresponds with a bullish engulfing and bullish accumulation on the very date. An opposite bullish engulfing pattern triggered on Jan 1 ’19 shows that the bearish decline may be a mare correction of the USDINR bullish trend.
In the current month of February, we anticipate a bullish accumulation in the event that price close bullish within the high/low range of January.
USDINR: Weekly Chart
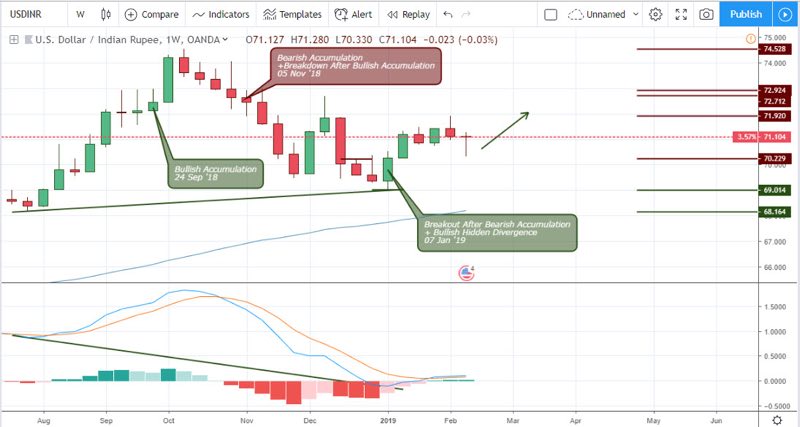
From the weekly chart above, a bullish engulfing pattern signaled after a bearish accumulation gives an early confirmation to the bullish divergence. On 28 January ’19, the long awaited bullish hidden divergence pattern is finally confirmed by a golden cross of the MACD oscillator, leading to further price increase in favor of the USD.
USDINR Daily Chart
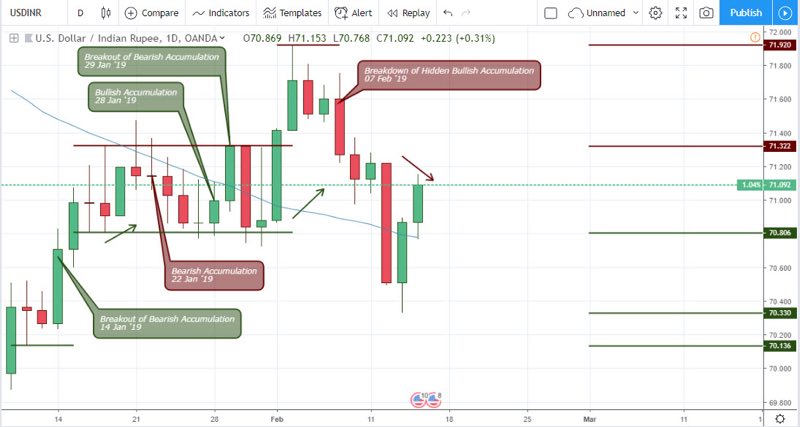
The exchange rates of the USD paired against the Indian Rupee got trapped in a bullish and bearish resistance (71.322) and support (70.806) setup by bullish and bearish accumulation patterns on 17 January ’19 and 28 January ’19. Price eventually broke out of the channel’s resistance on the first day of February and only moved a single bar upwards. Price close below the hidden bullish accumulation support on February 7 ’19 resulted in a 1.29% price collapse.
Most recently, the pair springs above the 65-period moving average and continues in a series of bullish closing bars. The 4hour time frame analysis below will illustrate a buildup of the patterns.
USDINR 4-Hour (H4) Chart
Looking above Olymp Trade analysts observe the critical resistant and support pattern combinations that brought the USDINR south, and later sends it up.
Bearish accumulation setup on February 07 ’19 18:00 caused price to fall by 042%. A breakdown below a critical support level forced price further south by another 0.78%.
Lastly, on February 13 ’19 02:00, the bearish decline ended by price signaling a bullish breakout after a bearish accumulation. This combination of patterns established a strong support at 70.332, leading to a 1.22% price increase which was later fueled by a formation of triple bullish accumulation on February 14 ’19 02:00.
USDINR 2-Hour (H2) Chart
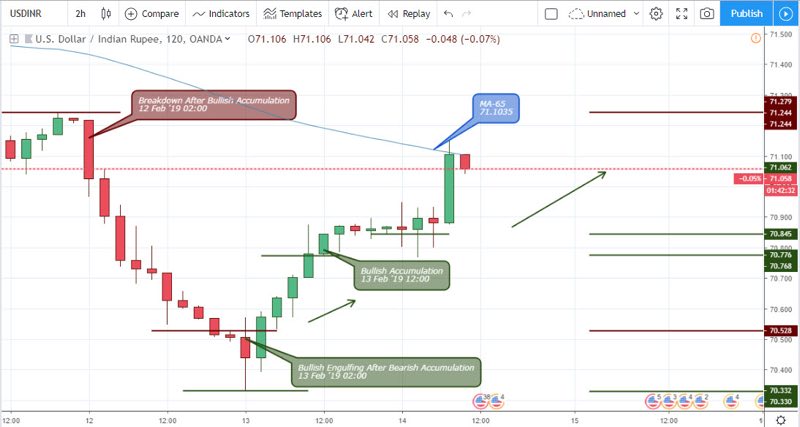
The 2hour chart gave confirmation to the 4hour chart by triggering the same bullish engulfing pattern after a bearish accumulation pattern. On this time frame, the trend was fueled by a single bullish accumulation pattern on February 13 ’19 12:00.
Conclusion and Projection
Mid way into the month of February, the US dollar shows strength against the Indian rupee as analyzed above. We look forward to a continued and sustained bullish trend as the higher monthly and weekly, and lower daily and 4hour time frames are in alignment as we project price to attain a 72.69 price target. For a list of regulated forex brokers to execute on bid or ask prices, visit the broker section of our website.

No Comments found