USD/INR – Weekly Outlook ( November 23 2018 )
USD / INR : Weekly Technical Analysis
Introduction
Starting off by making reference to the last analysis we did, we identified a failed bearish hidden accumulation pattern on the 2-hour char, hence projected further upward price movement. Well, our projection was not far from true, but the bullish rally only lasted for the 2-hour time frame, as the weekly charts bearish accumulation pattern switched market sentiment to bearish.
This week, however, we’ll be taking a look at the current technical price action of the USD to INR and the Bank of India. The chart below highlights the 2hour chart bullish move.
India’s Fundamentals
Reuters-Mumbai reported that the RBI (Reserve bank of India) estimated a lending capacity of 2.5 to 3.0 trillion Indian rupees in the coming year, following a boost of capital ratios by relaxing lenders deadline.
Bank of India Monthly Charts

From the above chart, we’ll observe that the price chart of the bank of India has been in a long-term bearish oscillatory motion that’s made up of mainly bearish accumulation and bearish hidden divergence patterns.
Going back to 01 February 2011, the monthly price chart triggered a triple bearish accumulation pattern establishing a strong resistance level at 489.30. This was later followed by a breakdown of bullish accumulation and a bearish hidden divergence pattern on 01 April 2013. Further bearish hidden divergence patterns were formed on 01 January 2015, and 01 December 2017. The most recent bearish hidden divergence formed in December 2017 also coincides with a breakdown of bullish accumulation in the same month.
An interesting bearish setup, that can’t be ignored, is the breakdown of bullish accumulation on 01 September 2018. This leaves a bearish resistance at 104.20, of which a bullish bar cross above the resistance level will indicate an end to the bearish trend and a probable trend reversal.
It’s also worth mentioning that the bearish breakdown pattern also breaks below the previous all-time low of 78.40.
Although we anticipate a bullish regular divergence comparing the price chart and oscillator, we’ll rather stick with the current downtrend as no bullish price action or oscillator crossover confirms this move.
Bank of India Weekly Charts
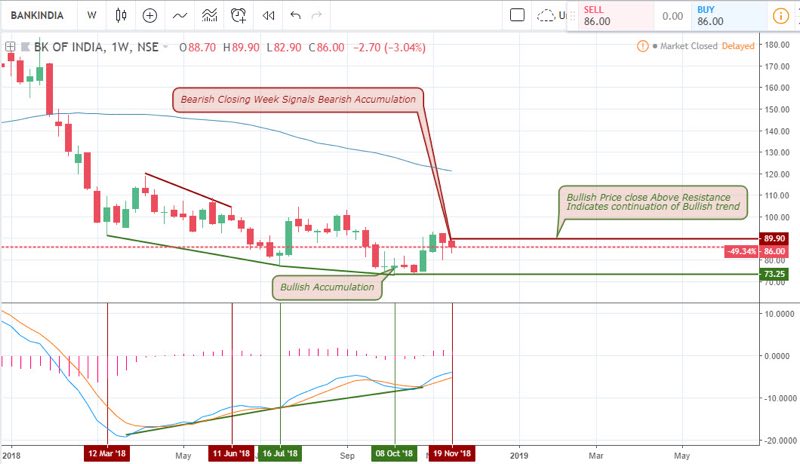
Taking a look at the above weekly chart of the Bank of India, you’ll observe that the price trades between a bullish and bearish divergence channel. However, the current week is trading below its opening price of which if it continues this way till the end of the week, we may be having a bearish accumulation pattern. In that case, a short sell trade is activated; on the other hand, a bullish close above the resistance level indicates a continuation of the bullish regular divergence pattern triggered on 08 October 2018.
Bank of India 4-Hour Charts
A bearish breakdown pattern formed on the 4-hour chart supports the anticipated bearish accumulation pattern of the weekly chart.
Technical Analysis
USDINR Weekly Chart
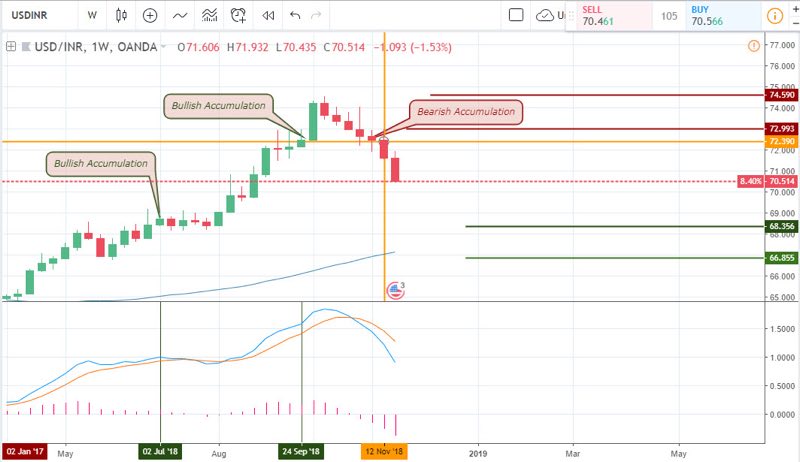
If you read our last post, you’ll notice that our short sell trade from the weekly time frame was a profitable low-risk one as the price did not close above the bearish accumulation resistance level. So far, the price has moved 2.99% south from the trade entry price with a 0.93% risk.
USDINR Daily Chart: Bullish Divergence
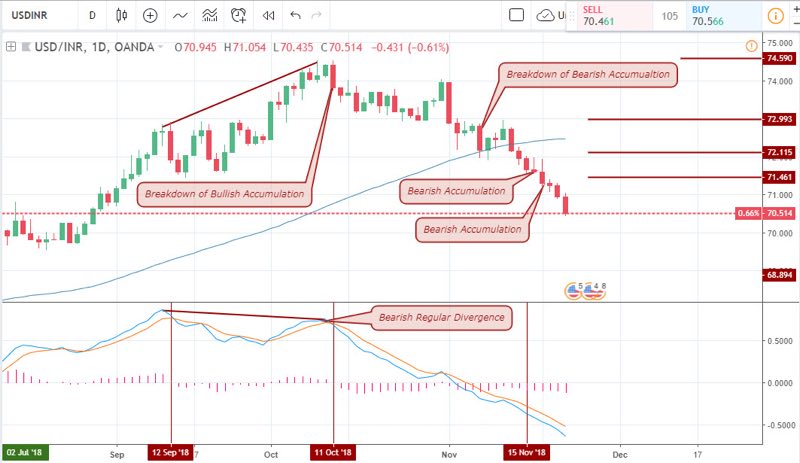
The breakdown of bearish accumulation in November, aligned with the bearish accumulation pattern on the weekly chart, and forced price to close below the 65-period moving average. This forced price into a series of consecutive bearish closing bars.
4-Hour (H4) Time Frame
The bullish regular divergence formed on 08 November pushed price towards the MA-65, and as price came in contact with this level, a breakdown of bullish accumulation was triggered, coinciding with the bearish accumulation of the daily chart.
Projection and Conclusion
Major time frames of the USD/INR are pointing toward the bearish direction indicating an increasingly strong Indian Rupee. Therefore following the weekly chart, for instance, foreign exchange markets expect the price to intercept the 65-period moving average, hence a dynamic target.
Also with the price chart of the Bank of India shares trading above the 65-moving from the 4hour chart, we expect a short-term strength of the Indian Rupee.
Top 3 India Forex Brokers to trade Indian Rupee.


No Comments found