USDINR – Weekly Outlook & Analysis for April 3 2019
USDINR Forecast & Technical Analysis
Introduction
This week the USDINR and other FX pairs on IQ Option transition into a new monthly candlestick, and showing strength for the US dollar.
Let’s turn to the time series charts of the USD vs. INR and perform a top-down analysis, identifying the critical support/resistance levels, technical chart patterns, and some fundamental indicators.
India’s Fundamentals
India Interest Rate Decision
Monetary policies are any efforts by a country’s government, its central bank, or monetary authority to achieve particular national economic objectives. These strategies are based on the link among interest rates and the total supply of money.
Policy rates are the usual significant measures within a nation’s financial policy, and a shift of policy rates influences the level of unemployment within the state, economic growth, as well as inflation, and exchange rates.
A higher than anticipated reading should be taken as a positive sentiment for the Singapore dollar. In contrast, a reading less than expected is seen as negative for the currency.
Most recent data of March 27 points to a bullish sentiment for the INR as the forecast and previous readings reads 5.15%, while the actual reading is 4.40%.
U.S. ADP Statement Nonfarm Employment Change
The U.S. ADP Statement Nonfarm Employment evaluates the monthly variations in private, non-farm employment. It is based on data from the salary structure of about 400,000 U.S. industry customers.
A greater than anticipated reading points to greater optimism in the construction sector and should be taken as a positive sentiment for the U.S. dollar. In contrast, a reading less than expected speaks of negative for the currency.
Most recent data points to a bearish sentiment for the USD as the forecast figure of the latest data read 170k, while the previous reading is 209K, and the actual reading is 183K.
USDINR Technical Analysis
USDINR Long term Projection: Bullish
Monthly Chart

Last month April candlestick closed above the previous all-time high of 74.528, bring the USDINR to gains of about 13.64% from the 63.160 Pin-bar low set on 01 Jul ’19.
The April open price came with a continued increase in demand for the US dollar over the Indian Rupee as traders seek safety in the world reserve currency.
Following entry of the overbought area, we maintain a bullish outlook on the USDINR for as long as there are no bearish counter patterns on the lower time frames.
Weekly Chart

The last week of the month closed bullish, signaling a cluster of buy orders, and confirms the likelihood of an extended upbeat swing. Bullish momentum has led to a price increase of about 0.94% from this week’s open, raising optimism to scale into the existing bullish trend.
USDINR Medium Term Projections: Bullish with High Volatility
Daily Chart
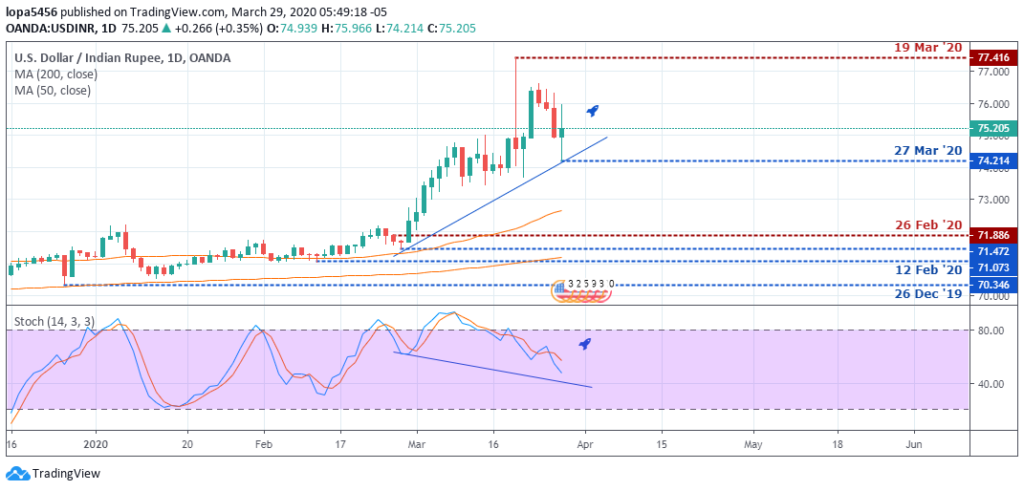
The daily chart shows the USDINR forming higher troughs, while the stochastic oscillator creates lower troughs, aligning with the bullish pattern on the weekly time frame. With that said, the upbeat swing should persist, going forward.
4HR Chart
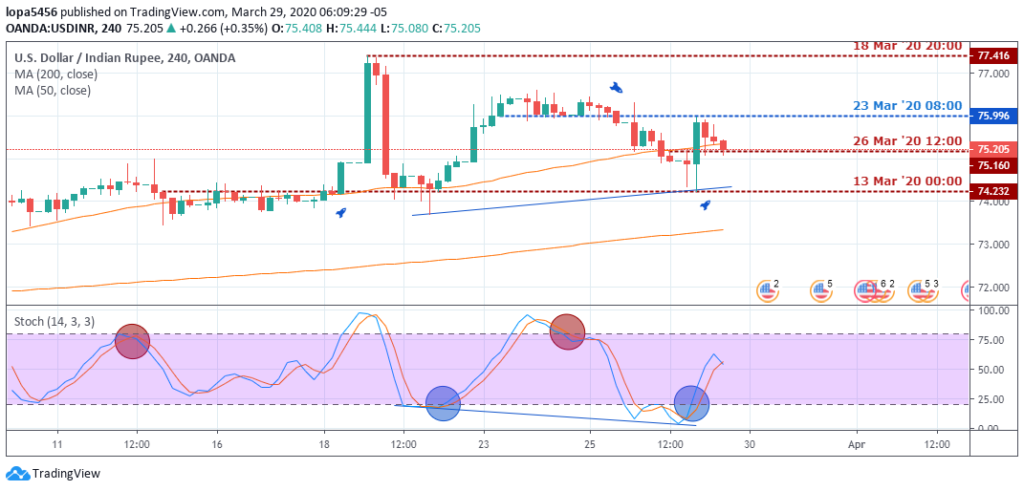
An overview from the H4 time frame shows the USD vs. INR flagging a bullish divergence while trading above the MA-200.
A price close above the selling cluster resistance on 31 March ’20 04:00, followed by a collection of buying orders on 31 March ’20 16:00 set the ball rolling for an upbeat price surge.
Conclusion and Projection
As governments of world nations impose lockdown and encourage social distancing among its populace, due to the coronavirus pandemic, we expect a further increase in the exchange rate going forward and look towards a significant price objective at 77.416.

No Comments found