USDINR – Weekly Outlook ( January 16 2018 )
USDINR : Weekly Technical Analysis for India Forex Trading
Introduction
Starting from the breakdown of bearish accumulation and bearish regular divergence patterns triggered on October 11 ’18, the Indian went on a bullish campaign and recovered about 6.42% gain in value. Read on as we further analyze the technical and fundamental events at play this week.
India’s Fundamentals
WPI Inflation (Dec)
The Ministry of Commerce and Industry released the WPI, which is a macro/fundamental indicator, similar to the CPI. The actual result for the WPI came out as 3.80% which is less than the previous which was at 4.64 %. This indicates a slowing of the economy and consequently bearish for the Indian Rupee.
United States Fundamentals
United States: Retail Sales excluding Autos (December)
The US Census Bureau is set to release the Retail Sales ex Autos on Wednesday 16 2018. This data is released monthly, showing all goods sold by retailers. This event is of high impact, at a previous value of 0.2%, the consensus is also set at 0.2%.
Technical Analysis
USDINR: Monthly Chart

The above monthly chart illustrates a bearish engulfing pattern on November ’18. A sudden rise in bearish volatility such as this usually implies an opposite recoil in price direction.
USDINR: Weekly Chart
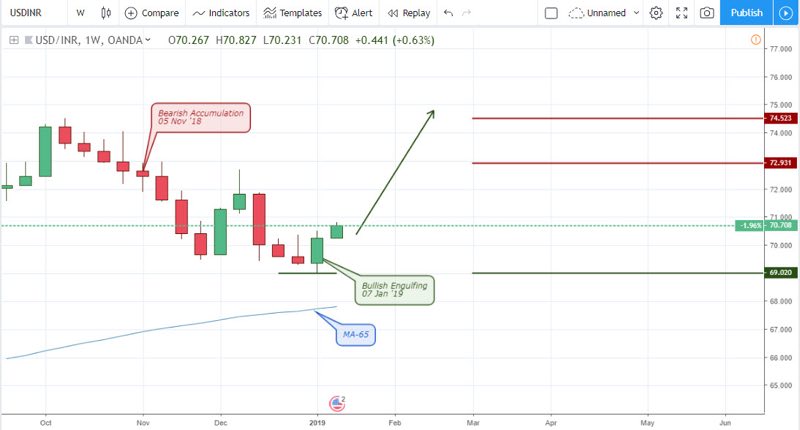
From a weekly chart perspective, the bearish engulfing pattern is broken down into a series of consecutive bearish bars. The increase in bearish pressure on November 5 2018 built confidence to enter a short selling trade for a 4.13% profit target compared to a 1.1% risk exposure.
USDINR Daily Chart
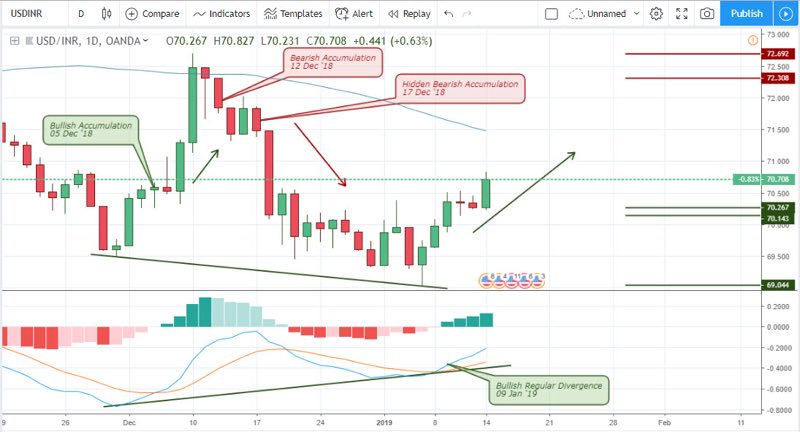
Before we can enter on a recoil as mentioned on the monthly chart overview, we need a strong reversal pattern from the daily chart to confirm it. The bullish regular divergence as shown above gives a clear illustration for such bullish recoil. A golden cross of the MACD oscillator on Jan 9 ’19 confirms a long entry in the bullish direction.
This bullish divergence pattern was built from the swing high triggered by a bullish accumulation pattern on Dec 5 ’18 and a swing low triggered by a bearish accumulation on Dec 12 ’18, both giving a profit of 3.09% and 3.4% respectively.
USDINR 4-Hour (H4) Chart
A regular bullish divergence was initialized on the 4hour chart, confirming a similar divergence pattern on the daily chart. This in combination with an accumulation pattern signaling bullish pressure on January 7 ’19 22:00 resulted in about 2.02% increase in the price of the Indian Rupee. The pair trades easily over the 65-period moving average, as it continues with a breakout of bearish accumulation on January 9 ’19 02:00.
USDINR 2HR Chart
The 2-hour chart above reflects a bullish campaign that started on January 2 ’19 02:00, by first triggering a breakout of bearish accumulation. This initial move resulted in a 1.23% gain for a possible buy trade.
An opposite breakdown of hidden bullish accumulation triggered on January 3 ’19 16:00 lead to a 1.25% gain in a bearish short trade.
Conclusion and Projection
The exchange rate of the USD to INR has commenced a bullish rally, indicating a strengthening of the US dollar against the Indian Rupee as shown on all India forex trading brokers.
From the above technical and fundamental indicators, we project the exchange rate of the USDINR to attain the 73.00 price level.
Top 3 India Forex Trading Brokers to trade Indian Rupee.


No Comments found