BTC/USD Weekly Outlook and Bitcoin Fundamentals , August 19 2020
BTC/USD Forecast and Technical Analysis & Fundamentals for Bitcoin
Introduction
The Bitcoin BTC price has not had a big move in the market as it did recently since April this year because of the COVID-19 pandemic and PlusToken. The uncertainty in the financial market, stocks among others made investors diversify their portfolios.
From the various recovery plans by governments and an increase in demand for De-Fi,s IQ Option traders should consider some variables that may affect bitcoin prices. The low-interest rates by Central banks across the globe and an increase in the supply of money will uniquely affect bitcoin.
BTC/USD: Technical Analysis
Monthly Chart

Monthly Resistance Levels: 12325.0, 13764.0, 19891.0
Monthly Support Levels: 3215.2, 4384.0, 6477.0
A retest of the previous resistance level of 13764.0 of 01 June 2019 is on the way as the bull surge pushes the bitcoin price higher.
The bullish momentum can close above the resistance should the bulls’ strength increases due to events around the crypto market.
A close above will expose the high of 19891.0 in the future while failure by the bulls will bring in the bears from that level, and we may have a double top price action, which will lead to a drop in bitcoin price.
Weekly Chart

Weekly Resistance Levels: 13880.00, 10933.26, 10500.50
Weekly Support Levels: 3850.00, 9312.00, 10500.50
Looking at the BTC/USD weekly chart, you can see that the bullish momentum was sustain, having closed above the 10933.26 with the bullish weekly candles indicating buying pressure.
As of 03 August 2020, we can see that the buying pressure increases as the double accumulation of bullish candles show more buyers entering the party. The India brokers hope to maximize the possible surge of bitcoin to the 13880.00 level.
Should the bitcoin price gets to the resistance level of 13880.00 of 24 June 2019, we may see the bears come into the scene from that zone as it did before.
Daily Chart
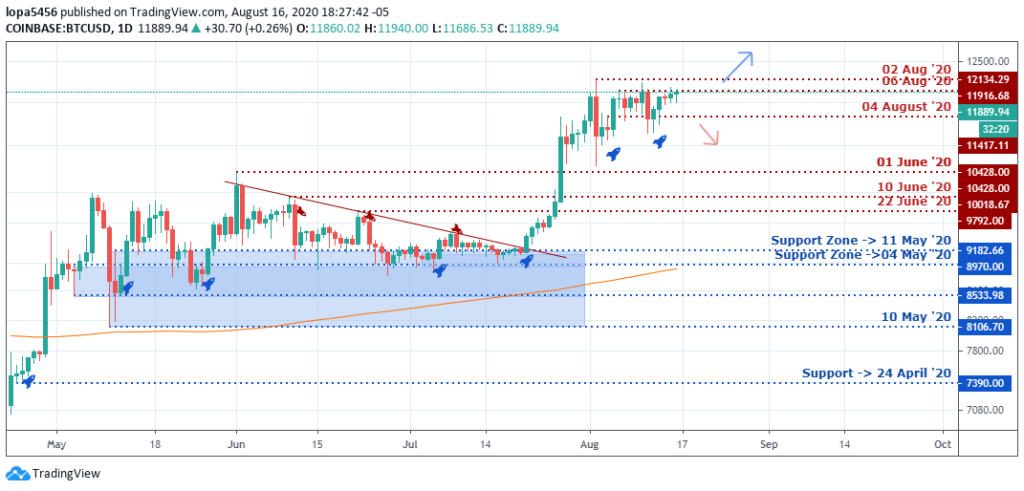
Daily Resistance Levels: 12134.29, 11916.68, 10428.00, 10018.67
Daily Support Levels: 8970.00, 9182.66, 1189.94
The bullish daily candle that closed above the resistance level of 10428.00 was a large candle showing the bulls’ strength towards the upward surge of the Bulls. The buyers were able to take the bitcoin price up from that breakout place to the 12134.29 level.
You can see that the bullish momentum reduced after the price of bitcoin was rejected at the zone initially.
The BTC/USD price is retesting the resistance zone, which might lead to a breakout above the ascending triangle for another swing high, or we get another rejection of price to the downside to the support zone of 10428.00 of 01 June 2020.
H4 Chart
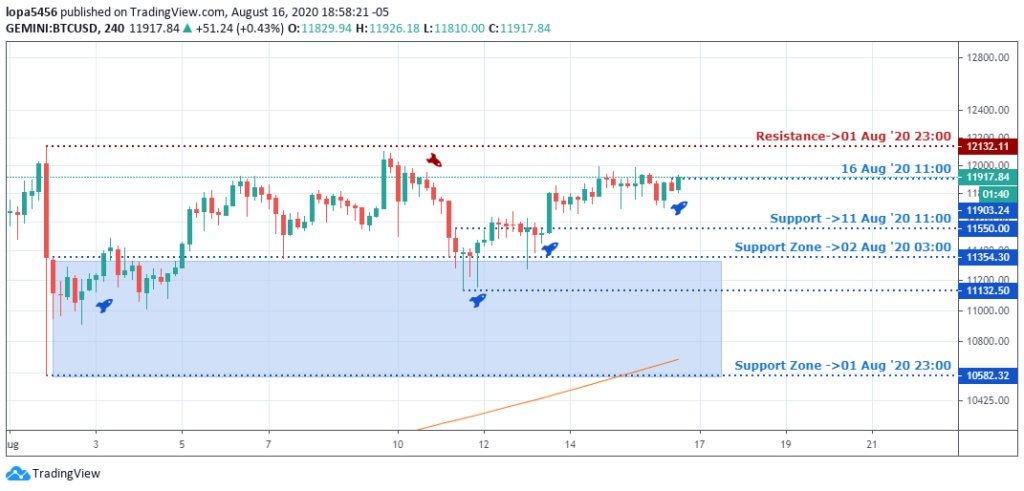
H4 Resistance Levels: 12132.11
H4 Support Levels: 11903.24, 11550.00, 11354.30, 11152.50, 10582.32
The Bullish harmer on support zone of 11132.50 and 11354.30 was able to push bitcoin higher and higher to where the price is at the time of the report.
If bitcoin’s value should close above the resistance level of 12132.11 of 01 August 2020, more buyers will place orders for long positions.
However, if the attempt to close above should fail, we will likely see another strong bearish candle pushing the bitcoin price down towards the 11550.00 level.
Bullish Scenario:
There has been strong bullish momentum in the past days and weeks from the above charts and time frames. We may see the correction of the trend on this higher time frame as the days unfolds.
A close above the resistance zones of 12134.29 and 11916.68 will mean a continuation of the trend from the daily time frame.
Bearish Scenario:
The bears are not in control of the market because the bullish trend has overturned all the significant levels into supports.
The only level the sellers hope to take control is at the 11916.68 and12134.29 levels of resistance.
The bears’ control may mean a correction of the uptrend, and if the price does not respect some key support levels, then we may experience a trend reversal.
Bitcoin BTC News Events
The Whale-clusters;
The COVID-19 pandemic has led many investors, India brokers, and institutions to find other ways to invest their resources because of the uncertainty in the financial market.
According to analysts, the 12134.29 and 14000 price levels of bitcoin are considered whale cluster zones, where buyers and sellers are going to clash considering bitcoin market cycle within that zone in the past.
At these zones, we are likely to see volatility in the bitcoin price as both sellers and buyers try to break away from the price range.
Institutional traders, investors, and big-time buyers must have invested for long positions contracts at the support levels of 9182.66 and 8970.00 with a high probability of an uptrend.
Having gained from the bullish surged, they whales intend to take the trend higher to 138880 level while those whose buy position is at the top hopes for a breakeven having waited for a long time before now.
Conclusion and Projection
On the daily time, we can see the whales in profit, having gone up 34.56% from the low of 8970.00 to the high of 12134.29 at the time of this report.
Should they pull their profit out, we may see a correction of the trend back to the support levels of 10428.00 or 10018.67 before the trend continues.
However, if the BTC/USD sellers can control the market, a correction of the trend is possible in the future.

No Comments found