USDINR – Weekly Outlook & Analysis for August 4 2020
USDINR Forecast & Technical Analysis for Forex
Introduction
The month of July has been an interesting one for the USDINR pair as revealed on options platforms such as s Binomo. It has witnessed high volatility due to the happenings around various economies around the globe.
India’s Fundamentals
Since the pandemic started, the Indian rupee has not had a strong gain against the dollar like July. As at the close of the week, the USDINR was closing around 74.6, as at the writing of this report.
In the coming weeks, the RBI’s monetary policy decision will be another area of interest for Indian brokers. The policymakers may slash the interest rates that will ease the economy and boost the recovery process for the various business sectors.
U.S. Fundamentals
Unemployment Rate forecast 10.5% while the previous 11.1%
Investors are looking ahead of the events opening the new week and new month of August 2020 as the US economy is among the watch list of online traders.
The high numbers of new cases amid the second wave of the COVID-19 are slowing down the hiring of the workforce some analysts believe because of lockdowns and weak dollar affecting some other businesses.
The number of the workforce within the previous month seeking employment is a significant key for the monetary policymakers in directing the affairs of the nation.
If the number of unemployed should drop lower than the forecast, it is suitable for the US dollar, while a higher number is not favourable to the US dollar.
USDINR Price Analysis
USDINR Long term Projection: Bullish
Monthly Chart

Monthly Resistance Levels: 77.00, 74.945
Monthly Support Levels: 68.3075, 63.25, 66.8113
The Double bullish accumulation of 01 May 2020 was not strong enough to take the price of USDINR up above the 77.0080 marks. As of July 2020, the USD dollar gained about 9.38% against the Indian rupee from the low of 68.3075 of 01 July 2019.
As of this report, we can see the month of July closing with a breakdown of bullish accumulation at the resistance levels of 74.9450 and 77.0080.
Should the bearish divergence forming on the chart and the stochastic indicator plays out, we shall see more short positions opened in the coming weeks to take the price down to 68.3075 levels of 01 July 2019?
Weekly Chart

Weekly Resistance Levels: 74.846, 77.416, 77.00
Weekly Support Levels: 70.194, 72.10, 74.172
A collapse of the support level of 74.846 and below shall expose the next level of 72.100 as of 19 August 2019.
A failed swing to the upside is a sign of a trend reversal, therefore, if the bears can overcome the psychological level of 74.172, we shall is a strong sell to the downside of USDINR, and the support level of 72.100 is exposed.
However, if the bears are unable to take over the market, we may see the Bulls take back the control from the position where the price is at the time of this report.
The previous resistance level turned into support is another zone that the Bulls have as an ally to take price up because of the price’s previous reaction.
USDINR Mid-Term Projections: Bearish Bottoming
Daily Chart

Daily Resistance: 77.000, 75.794, 76.330
Daily Support: 74.544, 73.832
The support zone of 73.832 and 74.544 has been rejecting the bears’ advancement for some days since the bears run pushed down the price from the 76.330 resistance zone of 16 June 2020.
If the bulls can sustain the level, we expect a bullish rise of the price back to the resistance zones of 766.330 and 75.794.
Let us see if the bear’s move will be able to go below the support in the level of 73.832 to attract more sellers in the coming days.
4HR Chart
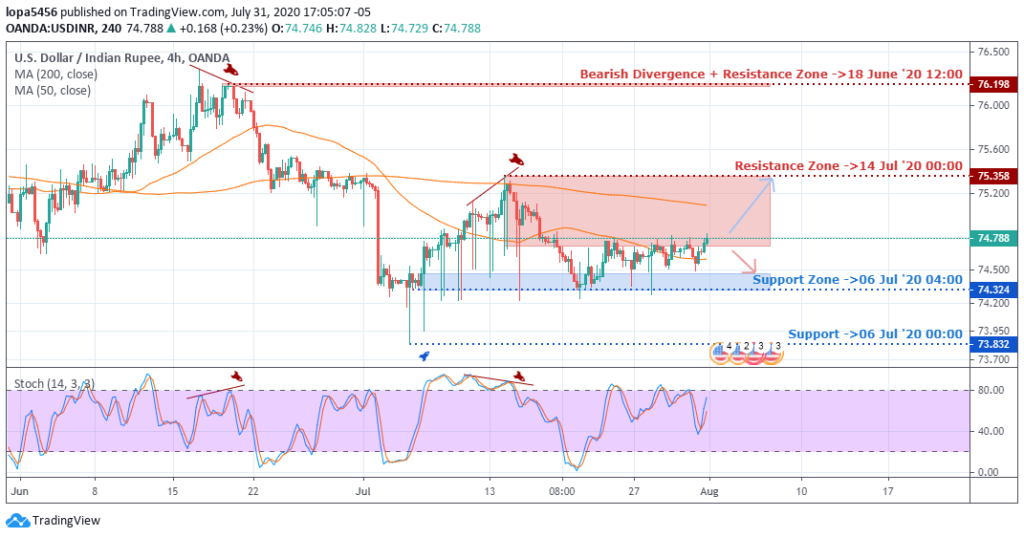
4Hour Resistance Levels: 76.198, 75.358
4Hour Support Levels: 73.832, 74.324
The USDINR is range-bound from the H4 time frame: resistance zone of 75.358 on 14 July 2020 and Support levels of 73.822 and 74.324 as of 06 July 2020.
The bearish swing to the low of 74.324 from the high of 75.358 has a strong momentum showing more sellers in the market. A close below the 74.324 level will expose the 73.832 level.
If the Bulls can have more buyers at the demand zone, we may see a bullish rally to the resistance zone of 75.358, and a close above it will expose the 76.198 level.
Bullish Scenario:
The bulls have to hold the support zone of 74.544, on the daily frame, and push back the price to the resistance levels of 75.794, 76.330 if they have to survive another bearish surge at the current support level.
Bearish Scenario:
The bears have shown full dominance of the bearish scenario on the weekly and daily time frames. The Indian rupee has gained about 3.20% vs. the US dollar in past days from 76.330 high to low of 73.832 (daily time frame).
We expect the bearish trend to continue if the bulls fail to close above the 75.358 and 76.198 resistance zones.
Conclusion and Projection
Online broker providers can only expect the best for the new month as we enter the first week in August. Though we expect a stronger Indian Rupee in the long term, the intraday H1 and H4 time frames may provide short term trades in favour of the Greenback.

No Comments found