EURUSD – Weekly Outlook & Analysis for September 24 2020
EURUSD Forecast & Technical Analysis for Forex
Introduction
Looking at the Forex platform for the week, we can see the Bulls trying to push the EUR/USD pair up for a possible breakout of the range it has found itself.
If the Bulls should succeed, the upward trend continues, while a failure will mean that bears can have a trend reversal or perhaps a correction of the bullish trend.
Fundamentals
Euro Zone
German Flash Manufacturing PMI
Germany’s economic activity largely influences the European zone; however, the numbers of new business activities indicate a healthy economy.
The survey from various purchasing managers will establish the economy’s true state-based on job creation, supply deliveries, and inventories, among others.
From the previous calendar, we can see that the result was favorable, with 53.0 against the forecasted 52.2. However, the forecast for the week is 52.0, while the previous data is 52.2.
A higher data than the forecast will mean a bullish run for the Euro currency, while a lower data will indicate a bearish trend for the currency.
The U.S.
Core Durable Goods Orders m/m
We see an increase in new orders towards durable goods by consumers, with the production managers showing an increase in the number of manufacturing activities to meet the demands.
If the data released by the census bureau is above the projection, it will be suitable for the US dollar, while more economic data below the forecast will affect the value of the US currency.
The forecast is 1.0%, while the previous data was 2.6%.
EURUSD Technical Analysis
EUR vs. USD Bigger Picture: Up-Trend
Monthly

Monthly Resistance: 1.25558,1.21545, 1.15698
Monthly Support: 1.03402, 1.06359, 1.08288, 1.10292
The EUR/USD bullish trend is still in play as the bearish candle for September has lost its steam to the downside as it could not go below the low of the previous month.
However, the resistance levels of (1.25558) 2018 February are the target for the Bulls since its rally started from the support levels of 1.10292 April 2020.
We expect the bull’s surge to continue into the resistance zones in the coming months before the Bears can take back control of the market at the confluence point where they had previously dominated the market.
Weekly

Weekly Resistances: 1.14963, 1.1422, 1.19207, 1.20114
Weekly Supports: 1.16959, 1.12430, 1.11726, 1.08968, 1.07197, 1.06361
We can see that the EURUSD pair ended in indecision candles (Long leg dojis), has rejected the move to the 1.16959 levels for the past two weeks. Investors and other institutional traders needed to ascertain the US Federal Reserve’s plans on the US dollar and for the safety of their investment before the USA presidential elections come up.
From the forex platform, you can see no sign of bearish momentum as the week began. A close below the 1.16959 support will drive the price down to 1.14963 levels while a close above the 1.19207 levels will mean a continuation of the bullish trend that will take the pair higher and higher.
EURUSD Mid-Term Projections: Bullish Consolidation
Daily
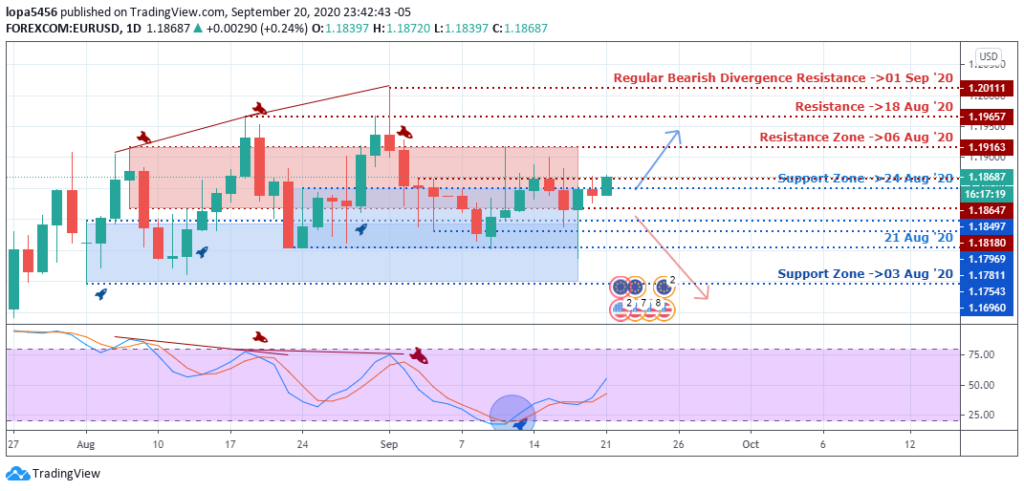
Daily Resistance: 1.19163, 1.19657, 1.20111
Daily Support: 1.17543, 1.18497, 1.18180, 1.17811
The EUR/USD exchange rate is trapped between the 1.19163 resistance and 1.18180 support, as the levels have become psychological levels for both Bears and Bulls.
The market awaits definite answers to some unknown uncertainties as traders expect an eventual break out of the range either to the top or the bottom.
At the publication time, we noticed that the days’ candle is bullish, and it is approaching the 1.19163 resistance levels before the close of the day.
A slump in price at press time shows weak bullish momentum, which may lead to a strong price correction or a complete switch in polarity.
H4
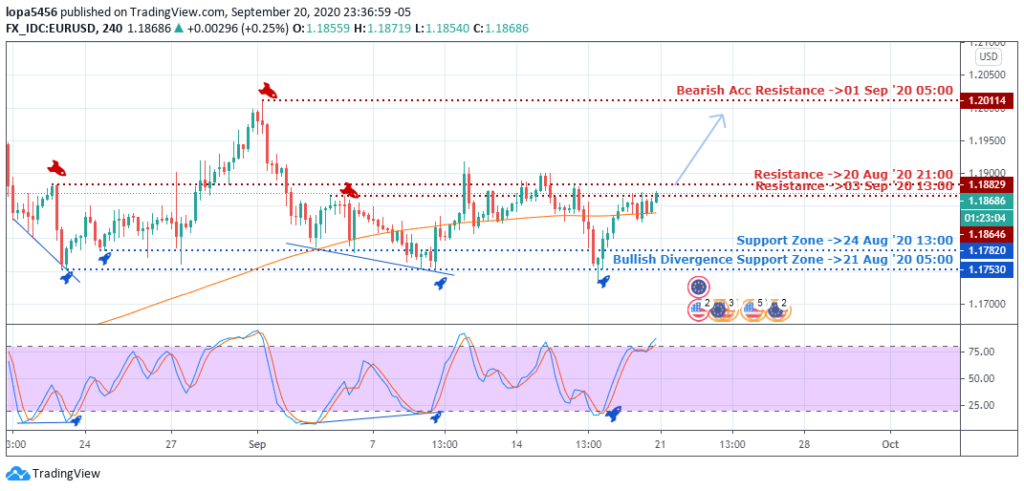
H4 Resistance: 1.20114, 1.18829
H4 Support: 1.17530, 1.17820
A bullish rally from the low of 1.17530 has taken price to the high 1.18829 03 September 2020. We expect a push above the level for another run to 1.20114.
For the bullish trend to resume, a price close above the high of 1.20114 will be a right trigger, but a failure at the zone will bring back the bears at the resistance levels, and they will push the EURUSD pair back to the 1.18829 and possibly lower.
Bearish Scenario:
A bearish scenario is expected in the weekly time frame, but the buildup has not been convincing.
Still, on the daily time frame, we can see that the three levels of resistance have not been taking out, which means that there are sellers at those levels based on the time frame, and they may find ways of pushing down the EURUSD pair.
Bullish Scenario:
A general bullish scenario has dominated the EUR/USD pair on the monthly and weekly time frames; therefore, there are probabilities for the Bulls to continue the trend this week as the pair’s price has been bullish for some days and on the four-hour chart.
Conclusion and Weekly Price Objectives
The US dollar has not come out from its weaknesses since the reopening of the global economy and trades among nations. The Feds’ approach may see the US dollar bounce back at some critical market levels in the nearest future.

No Comments found