USD to INR – Weekly Outlook ( July 10, 2018 )
Weekly Forecast for India Forex Brokers
Introduction
Following an intensifying trade war between U.S and Asia China, the USD to INR exchange rate happen to be moving into a range, as investors are believed to be moving out of the cross fire between the two economic giants.
Fundamentals events of the United State dollar and the Indian Rupees
Based on a private survey in Bengaluru-India, the nation’s service industry is beginning to make a rebound in June from the range experienced in May. Between the months of May and June, Purchasing Managers’ Index rose from 49. to 52.6, and climbed further to 53.3 of composite PMI recently. According to IHS Markit economist, Dodhia Aashna, the recent performance has been the strongest in an entire year. The IHS analyst continued by saying that the current increase in oil price and a weak rupee, lead to a further rise in inflation as retail inflation attains a 4 month high.
Moving to the United States, a research report from Merrill Lynch revised the earnings per share for S&P 500 companies higher this year. Using Thomson Reuters data, United States analysts estimated a 21 percent growth of the S&P 500 compared to the growth of the second quarter. These positive events boost the confidence of India Forex brokers and traders to take position in USD-pairs such as the USDINR
Technical Analysis
Adopting a trend following approach on a longer time frame requires a lot of patience, as the USDINR currency pair oscillates into a range from an intraday perspective. This allows range bound India forex traders an opportunity of trading inward the channel.
USDINR Monthly Chart

As the USDINR establishes a new high, which is higher than its previous highest high, the pair seems to be slowing down. Although a price close above the 68.9844 resistance level is not yet in place, the pair seems to be slowing in its bullish rise. Last month’s price close triggered a bullish accumulation phase. This price formation implies that though the pair may continue in an upward direction, there are potentials of mid-term price corrections.
USDINR Weekly Chart
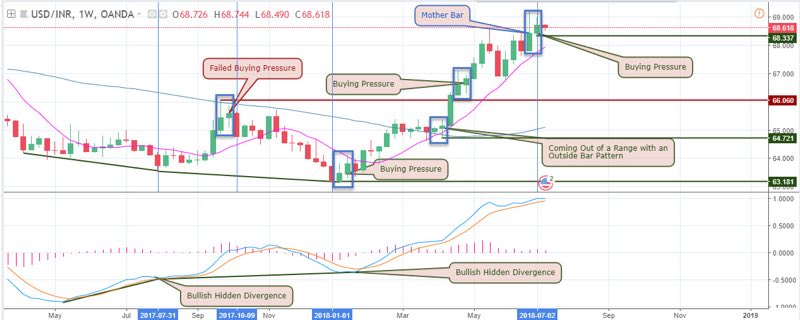
Similar to the monthly chart, last week’s candlestick is also in a bullish accumulation phase. In the event of a price close below the 68.337 support of the buying pressure, which is probable, a retracement of the bullish trend is imminent, causing the dollar to loosen its grip on the Indian Rupee. For the time being the pair is considered to still be in a bullish trend as the bearish close below support has not yet occurred.
USDINR Daily Chart: Bullish Divergence
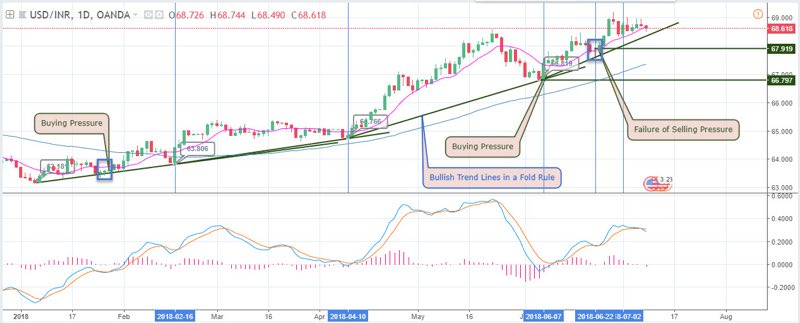
Above is the daily time frame, clearly showing the USDINR in a rising trend, and complying with the Fold-Rule setup depicted with the upward moving trend lines. In the event of price close below the current trend line, take profit time is triggered for those traders who joined the trend early. It also confirms a strengthening of the Indian Rupee and mid-term Short-selling opportunity. There are no clear buy entry signals yet on the daily chart this week.
4-Hour (H4) Time Frame
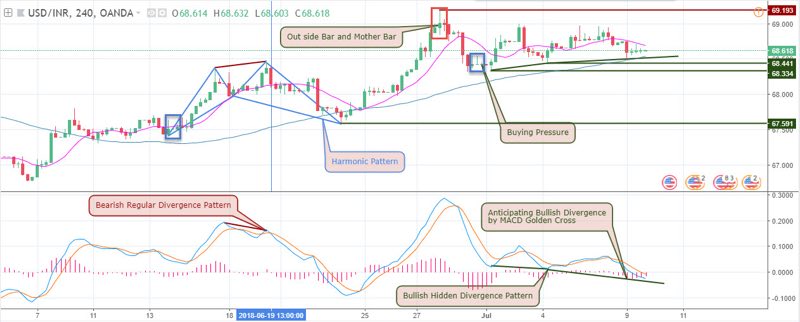
A Cypher bullish harmonic pattern was formed on the 4-hour chart coincides with the failure of selling accumulation on the daily chart. With a confluence of events on multiple time frames such as this further buttress a high probability entry setup in the direction of the bullish trend. Bullish hidden divergence setups formed on the 4-hour chart show signs that the pair may break forth out of the sideways market and possible upwards.
2-Hour Time Frame
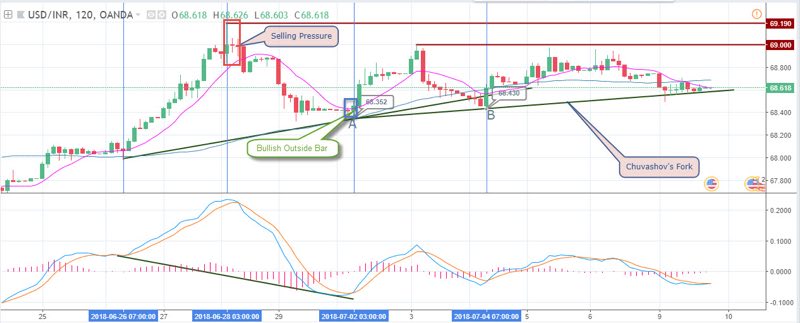
Here we concentrate more on the Chuvashov’s fork formed. A failure of the second trend line triggers a bearish entry signal. The 2-hours chart illustrates the ranging zone the pair has been in since the previous week into this week. Taking a position either up or down may be tricky.
Projection and Conclusion
Patience they say is a virtue. Trading the USDINR currency pair, we are looking for an opportunity to exit our current buy orders because adding to them at this point may be risky. On the other hand, a better approach for exiting our buy trades and entering Short-sell orders is to wait for the failure of the daily and 2hour chart trend lines. This signals a mid-term recovery for the Indian Rupees.
In a scenario where the anticipated bullish hidden divergence holds we might want to scale into the bullish trend.
Top 3 India Forex Brokers to trade USD to INR


No Comments found