USD/INR – Weekly Outlook ( December 9 2018 )
USD / INR : Weekly Technical Analysis for Indian Rupee
Introduction
The month of November was a good one for the Indian Rupee as the USDINR a 5.87% price decline, indicating a strong INR. Join us as we analyze the technical and fundamental events that move the pair.
India’s Fundamentals
M3 Money Supply
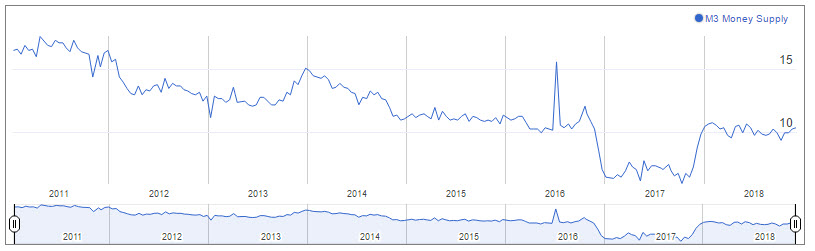
On Wednesday 4th of December, the Reserve Bank of India released the M3 money supply which is a measure of all the Indian Rupees in circulation. The actually released result came out as 10.4% which is higher than the previous by 0.1%. Looking at the historical pattern of the M3 money supply, we’ll observe that it has been in a strong decline since early 2011till late 2017. The current climb in the money supply plateaued throughout 2018; however, a positive outlook is maintained.
Bank of India Monthly Charts

Let’s do a quick recap of previous technical price patterns of the Bank of India. Starting from a breakdown of a bearish inside bar on April 2014, which continued to form a bearish hidden divergence pattern in combination with a breakdown of a bearish outside bar; a confluence of events such as this presents a highly probable short selling trade in the direction of the bearish trend. This led to a 65.15% decline in the share price of the Bank of India.
Two bullish accumulation patterns were formed on August 2016 and November 2016, forcing the share price to rise towards the 65-period moving average, where a breakdown of bullish accumulation was triggered on December 2017. This breakdown pattern is the starting point of the current bearish trend the above time series chart is currently in.
Bank of India Weekly Charts
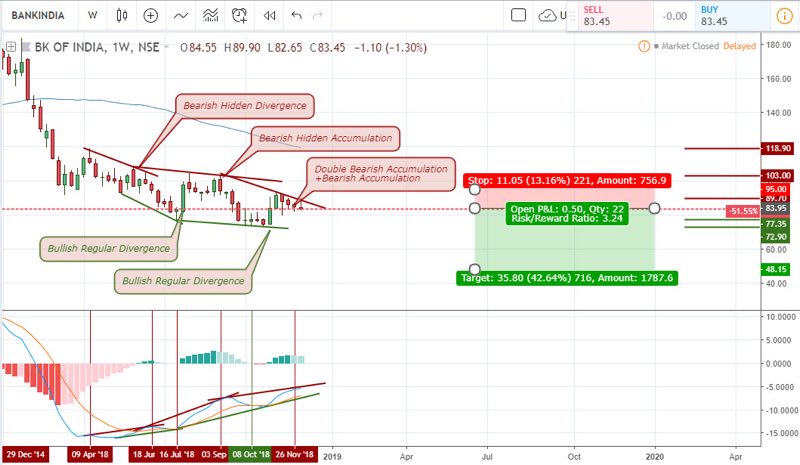
From the above weekly chart of the Bank of India, the price chart enters into an alternating bearish and bullish divergence patterns. The patterns were formed on June 18, July 18, September 3, and October 8, respectively. Another bearish hidden divergence pattern is anticipated as the price triggers a double bearish accumulation pattern on November 26, with resistance levels established at 89.70.
Bank of India 4-Hour Charts
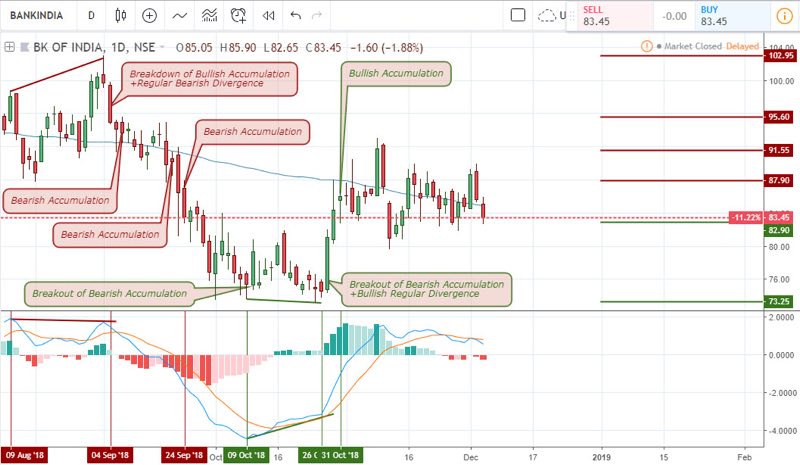
With bearish accumulation patterns currently triggered on the weekly chart, the 4hour chart started off with a breakdown of bullish accumulation, accompanied by a bearish and bullish divergence pattern sequentially as price trades above the 65-period moving average. A recently triggered bearish hidden divergence, confirmed by a dead cross of the MACD oscillator, initializes a bearish trend which is poised to break the mid-term bullish trend of the 65 period moving average.
Technical Analysis
USDINR Monthly Chart
From the monthly chart of the USDINR, the month of November closed bearish by confirming a bullish false break. As the new month is formed, and the Bank of India share price start showing bearish accumulation patterns on the weekly chart, the Indian Rupees slowly lose its gains. So far there is not much confirmation that this may be a continuation of the bullish trend, as we anticipate a bearish regular divergence. Let’s shift gear to a lower time frame for hints.
4-Hour (H4) Time Frame
The above 4hour chart lends a closer oscillatory nature of the USDINR chart as bearish hidden divergence pattern in combination with a breakdown of a bullish inside bar is triggered with price making a 1.36% decline. An opposite bullish accumulation pattern formed on November 30 ignites a campaign for a trend reversal as the month came to a close. This pattern is responsible for erasing the gains of the Indian Rupee. Another bearish hidden divergence was anticipated, but there was no bearish reversal pattern to support the move.
4-Hour (H4) Time Frame (Update)
The above chart shows an update to the 4hour chart as the MA-65 offers itself as a strong resistance. This moving average resistance level could not stand the test of time as a double bullish accumulation pattern breaks through the resistance level, leaving a strong support level at 70.448.
USDINR 2HR Chart
The 2hour chart, on the other hand, established a resistance at 69.836, a strong level where buyers are waiting to be violated in order to enter a long buy order. This eventually happened on November 30, coinciding with the 4hour chart, and consequently leading to a 1.55% bullish rally.
On December 6, A breakdown of bullish accumulation confirmed an early starting of a bearish regular divergence. This pattern later came to an end as an opposite bullish hidden divergence pattern pushed the pair up by 1.09%.
Projection and Conclusion
USDINR Daily Chart: Bullish Divergence
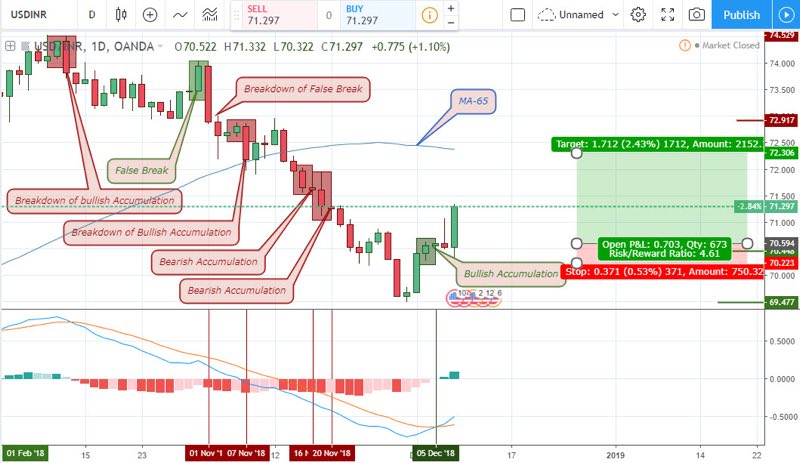
Last month’s gains of the Indian Rupee are gradually becoming depleted as the above daily chart triggers a bullish accumulation pattern. With this, we project a 2.43% rise of the pair and consequently a strong U.S dollar.
Top 3 India Forex Brokers to trade Indian Rupee.


No Comments found