USD/INR – Weekly Outlook for May 17 2019
USD to INR Forecast & Technical Analysis
Introduction
This week we’ll be considering the USD to INR currency pair as it loses momentum after coming out of an overbought state. We’ll also point out interesting fundamental events taking place in India and the U.S.
India’s Fundamentals
India FX Reserves in USD
The release of the Forex stocks by the Reserve Bank of India shows changes in the value of official reserve assets with a previous value of $418.69B, a consensus is yet to be agreed on while the current value will be released on the 17th of May at 08:30 GMT+2.
Thus reflecting acquisitions and sales (as well as swaps) of foreign trade by the Central Bank, profits on foreign bonds, and deals with reliable institutions overseas.
A high value is perceived as positive for the Indian Rupee, a low value, on the other hand, is viewed as negative.
United States Fundamentals
Initial Jobless Claims
The initial jobless claims measure the level of strength in the labour market. A larger than anticipated number registers weakness in the market which determines the health and path of the economy.
On May 10 228,000 jobless claims were made while the consensus was 227,000 and the current claims will be released on the 16th of May at 12:30 GMT+2.
A decrease in the value is usually held as positive for the USD, while an increase shows a weakness of the USD.
Technical Analysis
USD/INR: Monthly Chart

Attaching an RSI indicator to the monthly chart of the USD/INR reveals an overbought state of the pair as it crosses below the level-70 from above.
The current state of the MACDs’ moving average is converging as the MAs come closer to each other. This is reflected with a faint red histogram on the MACD sub-window.
A bullish closing candle in the current month of May reveals an end to the current price retracement.
USDINR: Weekly Chart

Coming one step down to the weekly chart, the pair came out of overbought as the RSI cross below level-70 on October 29 ‘18, and later transitions into selling pressure on November 05 ‘18.
The bearish trend from the overbought state shows deep oscillatory cycles as the pair currently shows a breakout of bearish resistance on April 22 ’19 setting support at 68.602, and 68.346 respectively. This aligns with the anticipated bullish accumulation on the monthly time frame.
USD/INR Daily Chart

A closer view from the daily chart reflects deep bullish and bearish swings, starting from the long outside bar on April 15 ’19, followed by a collapse of buying pressure on April 26 2019.
Another series of bullish closing bars was signalled on May 7, 2019, that last for five days.
The current bearish inside bar on May 14, 2019, shows the beginning of consecutive bearish closing candles.
USDINR 4HR Chart
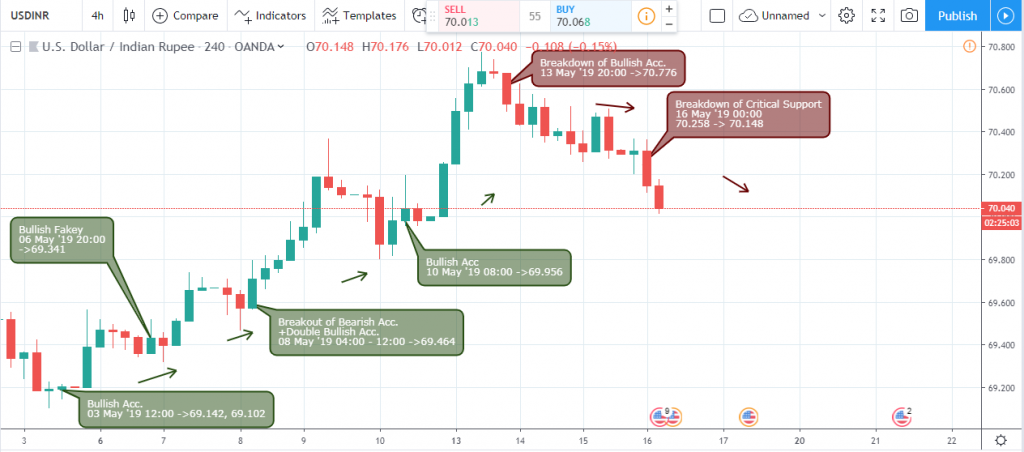
Moving further down to the 4hour time frame, we notice a buildup of the bullish trend that starts from a single bullish accumulation on May 03, a bullish Fakey on May 06, a breakout of selling resistance on May 08, and lastly a bullish accumulation on setup on May 10 2019.
The early collapse of buying pressure was revealed on May 13 2019, confirming the bearish inside bar on the daily time frame.
The breakdown of critical support on May 16, 2019, shows an increase in selling pressure.
Conclusion and Projection
The Indian Rupee is recovered from an overbought state, giving hope to the sellers of the USD to INR currency pair. Current deep bullish and bearish swings revealed on the monthly and weekly time frames show a possibility of the pair heading back into overbought territory which is represented by level-70 of the RSI.
Are you shopping for a broker, do not hesitate to stop by at the OlympTrade review section.

No Comments found