USDINR – Weekly Outlook & Analysis for 10th September 2020
USDINR Forecast & Technical Analysis for Forex
Introduction
We know the U.S. dollar has been weak due to various factors like the effect of the second wave of COVID-19, the US-China trade war, and non-agreement on the second stimulus plan between the Democrats and Trump’s administration, among others.
This week, we look into what the online traders expect from the forex platforms such as OlympTrade in September as we analyze the pair’s activity?
India’s Fundamentals
Since the peak of the coronavirus pandemic crisis, the PMI services has been low since March. The August PMI rose to 41.8 against the previous month of 34.2.
However, there are still weaknesses in private sector business activity as the economy’s recovery processes are not fast.
U.S. Fundamentals
Producer Price Index (PPI)
These data are obtained from the Department of Labor, and it shows the change in the price of goods that the manufacturers sold. These are leading indicators of consumer price inflation, which also serve as overall inflation.
If the result’s outcome is higher than the forecast, it is suitable for the U.S. dollar, while a lower data than the expected is a bearish move for the U.S. dollar.
The forecast is 0.2% while the previous is 0.6%
USDINR Technical Analysis
USDINR Long term Projection: Range-Bound
Monthly Chart

Monthly Resistance Levels: 77.0080, 74.9450, 74.0000
Monthly Support Levels: 68.3075, 63.2500, 66.8113, 74.9450
A straightforward divergence setup is seen from the monthly chart and the stochastic indicator, which signals a bearish trend.
The previous month closed bearish, breaking down the support zone’s bullish accumulation of 74.9450 that attracted the bears. As the new month unfolds, we may see a retest of the 74.9450 resistance level before continuing the trend that will expose the 01 July 2019 (68.3095) support levels.
Looking at the trading platform, we can see a strong Indian rupee playing out due to a weak dollar. We expect the Indian rupee to make some gains towards the support levels of 66.8113 before the dollar regains it’s strength unless the market dynamics play out for an uptrend continuation.
Weekly Chart

Weekly Resistance Levels: 77.000 74.846, 77.416,
Weekly Support Levels: 70.194, 72.10, 74.172, 72.066, 70.346
The weekly chat shows that the bear is in control of the market as we can see the U.S. dollar is weak generally across the board.
The India forex brokers can see that the psychological level of support (74.214) is broken with a strong bearish candlestick. This move indicates a downtrend for USDINR for some weeks until we see another reversal pattern.
The Indian rupee is gaining as we expect the price to reach the low of USDINR (70.346).
USDINR Medium Term Projections: Bullish Correcting
Daily Chart
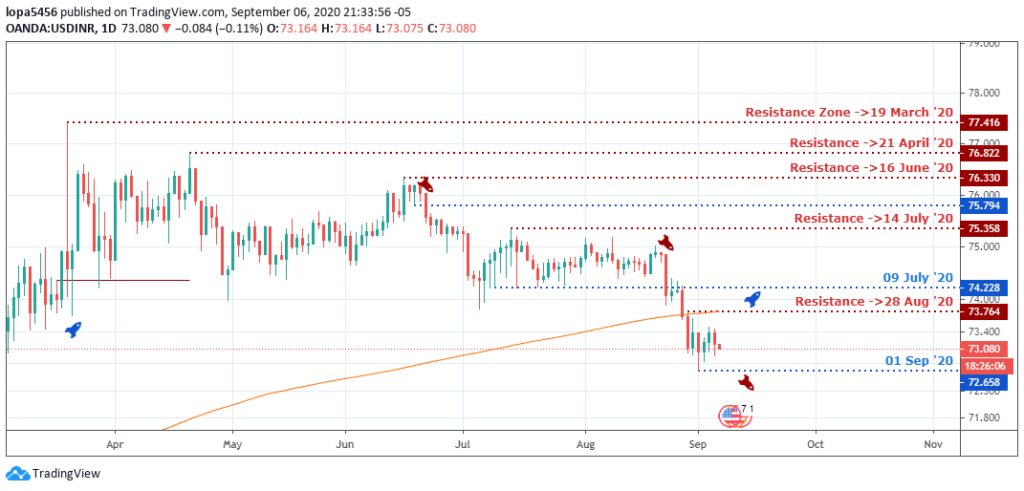
Daily Resistance Levels: 77.0, 75.794, 76.330
Daily Support Levels: 74.544, 73.832, 72.658
The USDINR pair had struggled for days to break and close below the psychological levels (74.228 and 74.000) on the daily time frame before the bears were successful.
The bears need to close below the recent support of 72.658 for another bearish swing to the south.
If the bears’ move should fail, and the bulls can close above the 73.764 and 74.228 zones, we shall expect the bull’s surge to push the pair back into the previous ranging zone of 75.358 and 74.228.
USDINR 4HR Chart- Range-Bound
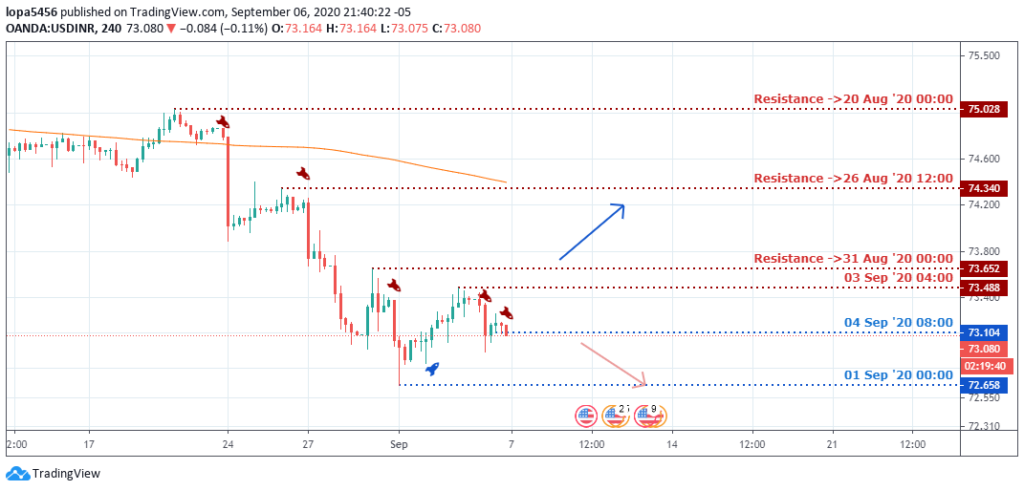
4Hour Resistance Levels: 76.198, 75.358, 75.028, 74.340, 73.652, 73.488
4Hour Support Levels: 73.832, 74.324, 72.658, 73.104
The four-hour time frame shows a clear bearish trend on the USDINR pair as it makes lower lows and lower highs. The bears have full dominance of the market on this chat at the time of the report.
A close below the 72.658 level will mean that the sellers are still in the market until a definite reversal is seen. The bullish wave will have to close above the 73.652 resistance to turn the trend around in their favour.
Bullish Scenario:
The Bulls scenarios on the time frames are quite slim as they have lost all momentum in the market due to the U.S. dollar’s general weakness. We may see another bullish surge from the weekly time frame when the price gets 72.066 or 70.346.
Bearish Scenario:
A general bearish scenario is on all the time frames because the Indian rupee is strong against the U.S. dollar, and it is a clear downtrend. A close below the psychological zone of 72.658 will attract more sellers into the market to continue the trend.
Conclusion and Projection
The USDINR pair is in a downtrend, and it’s on all the time frames, the Indian economy is recovering from the COVID-19 pandemic at a gradual pace.

No Comments found