USD/INR – Weekly Outlook & Analysis for 1st October 2020
USD/INR Forecast & Technical Analysis for Forex
Introduction
The week is loaded with strong USD/INR fundamentals that will determine the market’s direction in the coming weeks as we see the reactions of the news on the XM forex platform.
However, the U.S. presidential debate is another pointer for the online broker. Other investors want to understand what the candidates have in store for the domestic and Indian forex investors in their manifestos.
Let us look at the chart for a better outlook for the week.
India’s Fundamentals
The Indian economy was hit during the coronavirus pandemic like every other country since the total lockdown affected the global economy.
The weak dollar gave the Indian rupee edge over the currency amid the crisis, since the U.S. dollar had political concerns.
The policymakers intend to forecast the growth and inflation rate of the first time after the pandemic but will have to wait for a future date by the body.
U.S. Fundamentals
ISM manufacturing PMI
The Institution for Supply-Management does carry out some diffusion index levels through the information gotten from over 250 purchasing managers who are asked about the levels of business conditions within their scope and how prices, inventories, new orders, among others, have influenced the businesses.
An actual projection above the Forecast will be good for the U.S. currency, while an actual lower than the Forecast will mean that the U.S. dollar will be bearish.
The Forecast is 56.0, while the previous is 56.0.
USDINR Technical Analysis
USDINR Long term Projection: Range-Bound
Monthly Chart

Monthly Resistance Levels: 78.00, 74.9450
Monthly Support Levels: 66.8113, 68.3075, 63.250
Looking at the monthly chart, you can see the bearish divergence built up at the resistance levels of 78.0000 levels is playing out, having the bears take out the double bullish accumulation support levels of 74.9450. The September candle has been a resting period for the bears after closing firmly in August.
There is a possibility of the bulls to retest the 74.9450 zones before we see another bearish swing that will close before the August candle’s low that will expose the 68.3075 support levels.
Weekly Chart

Weekly Resistance Levels: 74.255, 75.496, 76.33, 77.416
Weekly Support Levels: 72.950, 72.066, 70.194
The Indian rupee finally broke the range with a robust Marabuzu candle after weeks of struggles between the 76.330 and 74.255. The bears are likely to push the USDINR pair to the support level of 72.950 as the bearish trend continues in weeks to come.
However, the bulls may push back the pair into the previous ranging zones and break above the 75.496 levels if they get more robust because of good fundamental news in favor of the U.S. economy.
If the bullish movement should succeed, it will also mean that the bear’s breakout was a fake-out, and it traps most traders with short positions.
USDINR Medium Term Projections: Bullish Correcting
Daily Chart

Daily Resistance Levels: 77.416, 76.822, 76.33, 75.794, 75.358, 74.228, 74.038
Daily Support Levels: 72.658
Our daily chart shows the lower highs and lower lows pattern of Dow’s theory, indicating a downtrend on the above chart. The Indian economy is recovering gradually as the country reconnects back to the worlds’ economy for trades.
At the time of the report, you can see the price retest the 74.228 levels, which can serve as a resistance against the Bulls, or it ends up becoming support for another surge to the 75.358 resistance.
If the Bears are in full control of the level (74.228), we shall see a bearish run to the 72.658 support level in few days to come.
USDINR 4HR Chart- Range Bound
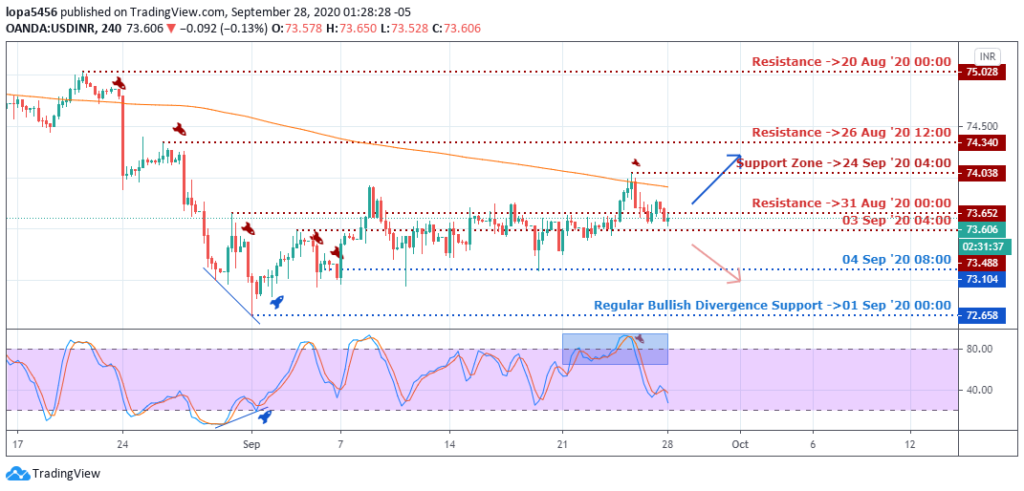
4Hour Resistance Levels: 75.028, 74.34, 74.038, 73.652
4Hour Support Levels: 72.658, 73.104, 73.488
You can see USD/INR had been a downtrend for a while as price moved from the resistance level of 75.028 down to the 72.658 level before a bullish divergence pushed back the price support level.
Presently, the USDINR pair is trapped between the 74.038 and 73.652 levels waiting for a breakout to either side. A close above the 74.038 level will expose the next level of 74.340, while a bearish close below 73.652 will push the price to the low of 73.488 and lower.
Bullish Scenario:
The bullish scenario on the four hours’ time frame is very slim because the bearish dominance can be seen countering every bullish surge. The Bulls have to close above the 74.038 level for them to have Signiant in the market.
Bearish Scenario:
There has been a general bearish scenario on the higher time frames like the weekly and daily charts. For the bears to continue the trend, we need to see them close below the daily chart low (72.658).
Conclusion and Projection
As we go into the last week of September, the price reaction around the psychological level of 74.038 will determine the next direction of the USD/INR pair as we enter into a new month.

No Comments found