USDINR – Weekly Outlook & Analysis for July 23 2019
USDINR Forecast & Technical Analysis for Forex
Introduction
India’s’ number of COVID-19 new cases is of concern to India forex brokers considering that it increases uncertainty in the Indian forex market.
The number of new cases rose in some states in the USA because of negligence on individuals and state governments.
Let us dive into the charts to see how the market has reacted in the trading sessions of the various time frames.
India’s Fundamentals
To every story of life and things happening around us, we have the negative and positive sides. Some Indian merchants practice an old principle of trading that worked out well for them. During the COVID-19 crisis, merchants bought Gold as collateral, and they saw a significant surge in the value of Gold because it is a haven asset.
The Indian forex market was boosted with some gains against the US dollar as the stock market gained 1.5% at the close of the day on Friday. At the end of the trading week, Sensex gained 1.2%, which is encouraging for investors and good for the Indian rupee.
US Fundamentals
The Conference Board Inc:
Forecast data is 2.1%, while the previous is 2.8%.
The coronavirus did havoc on the global economy and crippled many businesses around the world. The new trend of the second can send a recovering economy back to the hospital bay if a dangerous procedure is not implemented.
Policies makers put together different kinds of indicators to aid them in analyzing the state of health of the country’s economy. However, these are leading indicators, and they are made up of 10 economic indicators that are used for predicting the country’s economy’s possible direction.
These indicators are related to new orders, credit trends, interest rates, housing, employment, and consumer confidence.
When the actual data release is higher than the forecast, it is bullish for the US dollar, but if the expected is lower than the forecast, it is bearish for the dollar.
USDINR Price Analysis
USDINR Long term Projection: Bullish
Monthly Chart

Monthly Resistance Levels: 77.0080, 74.9450
Monthly Support Levels: 68.3075, 63.25, 66.8113
The India Forex market has been quiet for three months on the monthly chart following a crippling of the global economy by the COVID-19 pandemic.
The recent swing from the low of 01 June 2018 was at support with a double bullish accumulation at the support level of 68.3075 to the high of 01 May 2020, a resistance level that has slowed down the bulls run.
From the above chart, you can see that the Bulls have not been able to surge beyond the resistance level of 77.0080. As of 01 May 2020, a bearish divergence was building up with the setup on the stochastic indicator for a bearish move.
Furthermore, you can see that there is a breakdown of bullish accumulation as of 01 July 2020, which indicates that the bears are gradually taking over the market.
Weekly Chart

Weekly Resistance Levels: 77.416, 75.496, 76.33
Weekly Support Levels: 70.443, 72.066, 74.214
The resistance level of 72.066 that was turned to support as of 11 November 2019, gave way to the buyers to be in control of the USDINR pair, and they were able to push the price to the resistance level of 77.416.
From the chart above, you can see the USDINR pair has been ranging within the resistance level of 77.416 and support level of 74.214, which is of importance to the online broker. These two levels are psychological in the bid to make a favorable decision.
If the uptrend continues its bullish rally, we expect a strong bullish momentum, and perhaps a significant candlestick pattern to find support at the 74.214 and close above the 76.330 resistance level for an uptrend.
However, if the Indian Rupee is to make a significant gain against the US dollar, it needs to take out the psychological level of support, which is the 74.214 to expose the 72.066 level.
USDINR Medium Term Projections: Bullish with High Volatility
Daily Chart
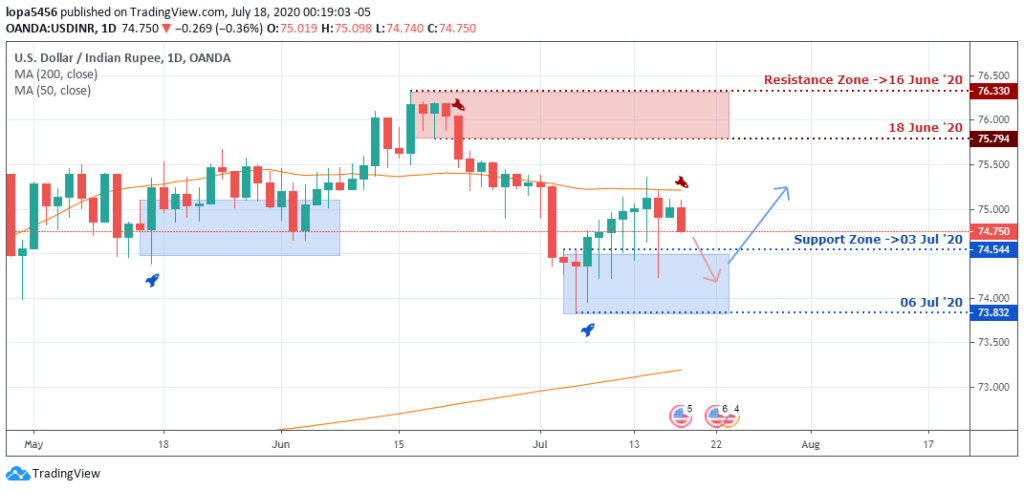
Daily Resistance Levels: 75.358, 75.794, 76.330
Daily Support Levels: 73.832, 74.544
Considering the daily chart, you can see that the Indian rupee had an excellent gain against the dollar by taking the price down from the 76.330 to 73.832, making about 3.34% gain.
At publication time, the bears are pushing back the price after it bounced from the support level of 73.832.
The bullish strength to the upside has been met with a lot of resistance from the bears, and they have to reject the advancement of the bears at the support level if they must have control.
4HR Chart
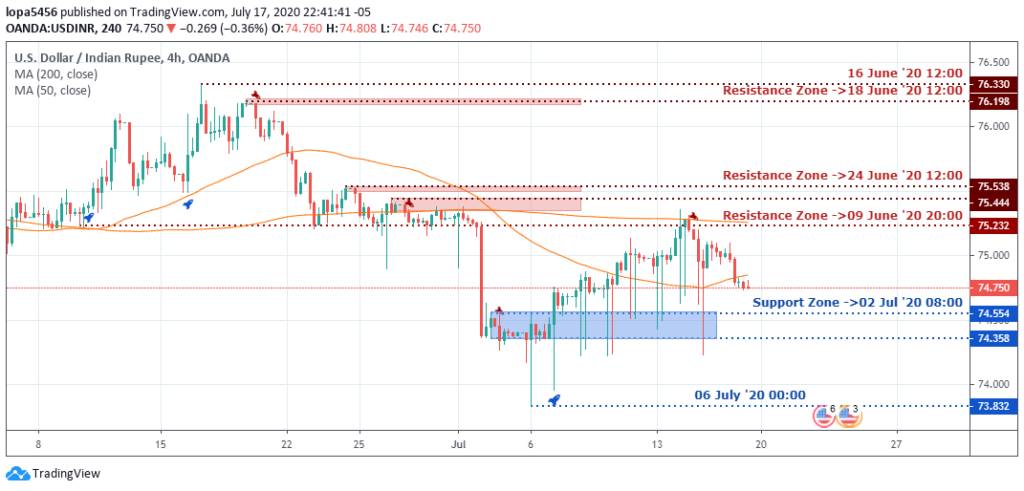
4Hour Resistance Levels: 75.444, 75.232, 76.198, 76.33, 75.44, 75.538
4Hour Support Levels: 73.832, 74.358, 74.554
The Indian rupee has been establishing a strong resistance has it keeps making lower highs and lower lows from the chart. There was a bearish rally from the strength of 16th and 18th June 2020, respectively (76.330 and 76.198).
After the swing low, the pair ranged between 75.538 and 75.232 before a sharp breakout below with a bearish marabuzu candle. The 75.232 level is still acting as resistance after the retest of the price before it pushed it back towards the 74.554 support level.
The USDINR pair had a series of price wars at the 74.554 and 73.832 support levels. We can see multiples of bear pressures and the rejection of the price by the bulls. In the coming hours, the direction of the price will be more precise for the online brokers and other traders following the pair.
Bullish Scenario:
We can see that the bullish scenario can still come to play if the new support zone of 74.214 is not overrun from the weekly timeframe. The bulls have to reject the bear’s pressure and take out a 75.496 resistance level for it to be in control.
Bearish Scenario:
The weekly time horizon shows the recent high fail to go higher than the previous high, showing weakness in the bulls’ momentum. If the bears can take out the 74.214 level in the coming weeks, the Indian rupee will gain a good gain against the US dollar.
Conclusion and Projection
The US dollar is weak, and the second wave of the coronavirus is threatening the reopening of the US economy as more states are now having high numbers of new cases.
The new week will give a clear path when the psychological levels are taking out. The bears need to overcome the 73.832 level on the daily chart while the bulls need to close above the 76.330 level. It is advisable to trade safely due to uncertainty in the market, and the effect of the pandemic is still having its toll on the economy.

No Comments found