USD/INR – Weekly Outlook for June 13 2019
USDINR Forecast & Technical Analysis
Introduction
The Indian Rupee following a huge bullish gain struggles to move beyond the 68.346 support, twelve weeks after establishing the level on IQOption, a major India brokers’ platform.
This week we’ll look into events in the US as well as technical price patterns for gatekeeping, which have kept the pair within the current range.
India’s Fundamentals
India 50 IN50
Viewing the India50 from a daily chart perspective shows exhaustion in buying pressure, as the pair exits the overbought area on 04 April ’19, as well as signal regular bullish divergence setups on 18 April, and 05 June ’19 after exiting oversold on 14 May ‘19.
United States Fundamentals
UoM Consumer Sentiment
The University of Michigan Consumer Sentiment Index is a leading indicator that makes it possible to gauge the level of confidence the consumer has on the economy both current and future.
Growth in consumer confidence indicates a bullish economy, which is equally favorable for the USD.
Starting from January ’19 till May last month, the UoM consumer confidence has risen from 91.2 to 100, after making a dip from 98.4 in March to 97.2 in April.
USDINR Technical Analysis
USD/INR: Monthly Chart

Following a surge in the price of the USD to INR from the bullish trigger on 02 July ’18, the Indian Rupee suddenly plummets on 01 November ’18 and so far been in a ranging formation. The Indian Rupee has been making lower highs with resistance at 74.528, 71.920, and 70.776, with support set at 68.346.
USDINR: Weekly Chart

The weekly time frame of the USDINR better represents the descending channel when picking the 72.69, and 71.92 as reference points for our trend lines, the trend projects to 13 May ’19 where it serves as resistance at 70.776.
A breakout of resistance on 22 April ’19 shows possible recovery of the bullish trend. For the upbeat campaign to be confirmed, the pair needs to break out of the bearish resistance tend line.
On the other hand, if the price close below the 68.602 support, we may be looking to enter a short sell order.
USDINR Daily Chart

Viewing from the daily time frame, bullish and bearish swings, with consecutive closing bars on 15 & 26 April, 07 & 14 May ’19 are observed.
The price heads south after a break below the bearish inside bar support on 14 May ’19, with resistance at 70.776.
Above is an update to the chart showing a Cypher harmonic pattern after an approximate 1.80% price plummet.
USDINR 4HR Chart
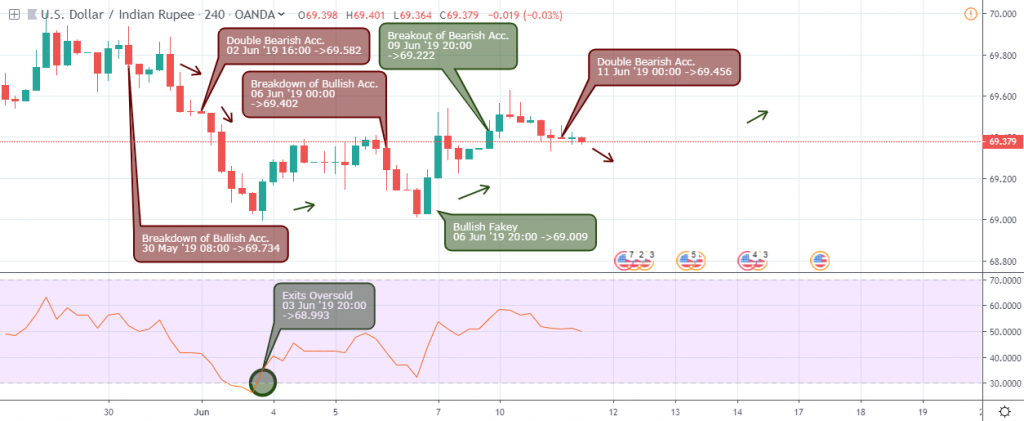
From the 4hour chart perspective, the pair signaled a gathering of bulls on 03 May ’19 12:00, initializing a start of the consecutive bullish closing candlesticks from the daily view. Other bullish triggers that sent the pair up by % include the bullish Fakey pattern on 06 May ’19 20:00, a break of resistance on 08 May ’19 04:00, and bullish support on 10 May ’19 08:00.
The bearish price descent was initialized by a failure of bullish support on 13 May ’19 20:00, and setting resistance at 70.776.
Conclusion and Projection
Considering the current technical patterns on the 4hour time frame, this week we look forward to the price signaling consecutive bearish closing bars on the daily chart with the long term bullish support on the weekly chart as possible profit-taking level.
On the flip side, if the 68.602 support holds, we should expect a continuation of the long-anticipated bullish trend to continue.

No Comments found