USD/INR – Weekly Outlook & Analysis for 27th May 2021
USDINR Forecast & Technical Analysis for Forex
Introduction
The numbers in the cases of new infection are dropping in Indian which is boosting the Indian shares higher than we can see on the Indian forex platforms.
The State bank of India SBIN and private-sector lender HDFC Bank were among the top boosts to the Nifty 50 with 2.7% close higher than HDFC Bank that closed with 0.8%.
India’s Fundamentals
COVID-19 cases are falling in numbers as the news will lift the mood of investors further as the data from the ministry of health shows daily cases of the coronavirus stays lower than the marked figure daily.
A steady decline in the number of fresh COVID-19 cases will lead to the easing of the lockdown policy sooner than expected which also boosts the gain of the Indian rupee against the US dollar.
The Indian government is planning a stimulus package for sectors that are affected most by the deadly coronavirus waves to support its economy that is locked down locally.
The government is working to bolster the aviation, tourism and hospitality industries alongside small and medium-sized companies. The proposed plan is still in the early stage.
However, the central bank is under pressure to ease loan repayment rules, especially for sectors that are most affected by the virus waves.
US Fundamentals
Gross Domestic Product GDP
The report comes in an annualized format comparing the change in the value of all goods and services produced in the country by the economy within a specific time. They released it 60 days after the quarter ends. The GDP measures the economic activity of the country in a broader way and it is also the primary gauge of the health of the country’s economy.
If the actual data is greater than the forecasted, it is good for the US dollar but a lower outcome than the expectation will not favour the currency.
The previous data was 6.4% while the forecast is 6.4%.
USDINR Price Analysis
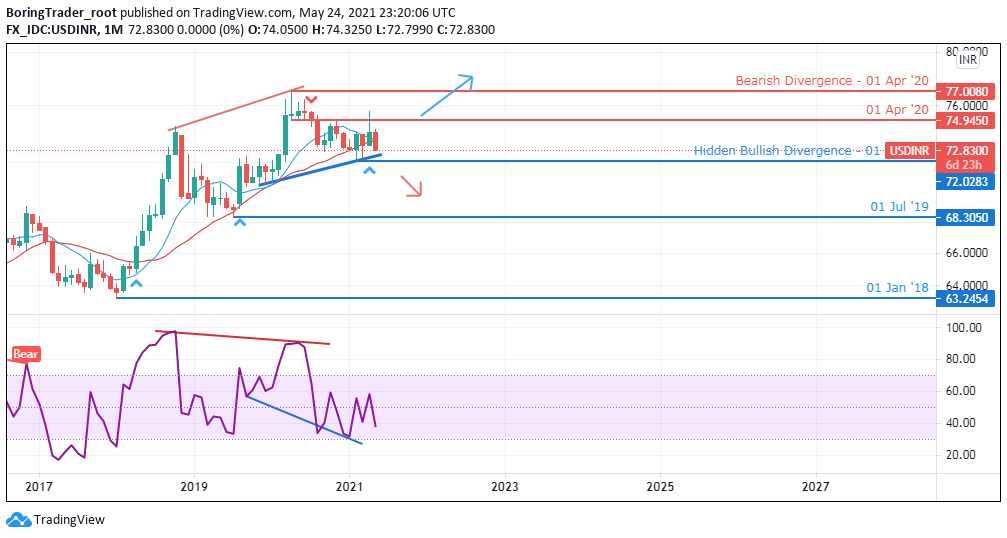
Monthly Chart Projection: Trades Within Correction Zone

Monthly Resistance Levels: 77.00, 76.00
Monthly Support Levels: 72.00, 68.30
The Indian rupee has been growing stronger in the financial market against the US dollar having rejected the bull’s advancement from the 74,9450 zones that has turned into a resistance.
We can see that the seller’s momentum in the market is high and a close below the support level of 72.00 will lead to a waterfall in the market against the US dollar.
However, if the support zone is not broken down, we may see the USDINR pair shoot up for an upward trend from the area of focus.
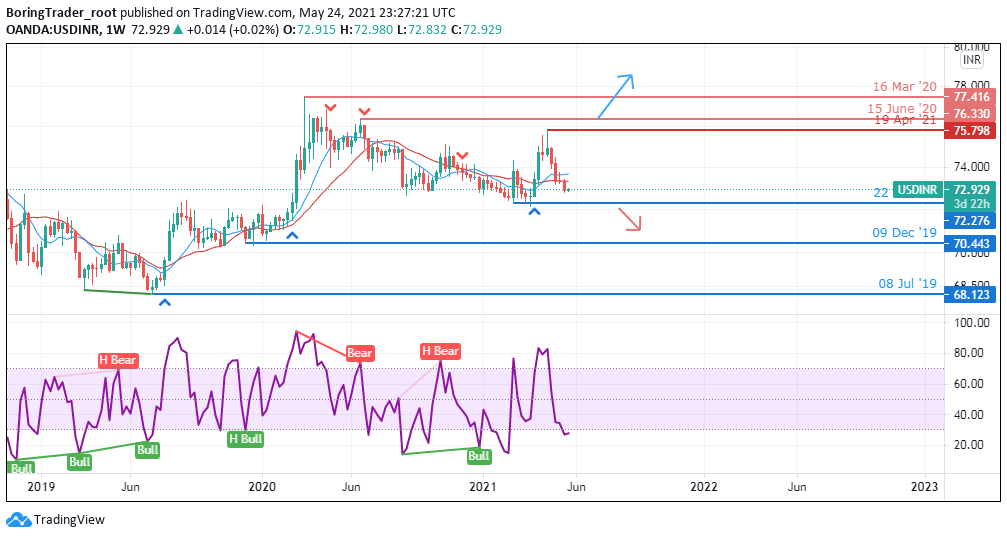
Weekly Chart

Weekly Resistance Levels: 75.798, 76.330
Weekly Support Levels: 72.276, 70.443
The online broker will have to be careful as the price is approaching a tested support zone because the indicators below the chart show that the price of the USDINR pair is within the oversold region and we are likely to see a trend reversal soon.
A close below the 72.276 level will stretch the price to a lower low of 70.443 if the zone is broken. Another twist can happen around the 72.276 zones for a double bottom chart pattern which will push the price of USDINR up for a rally to test the high of 75.798.
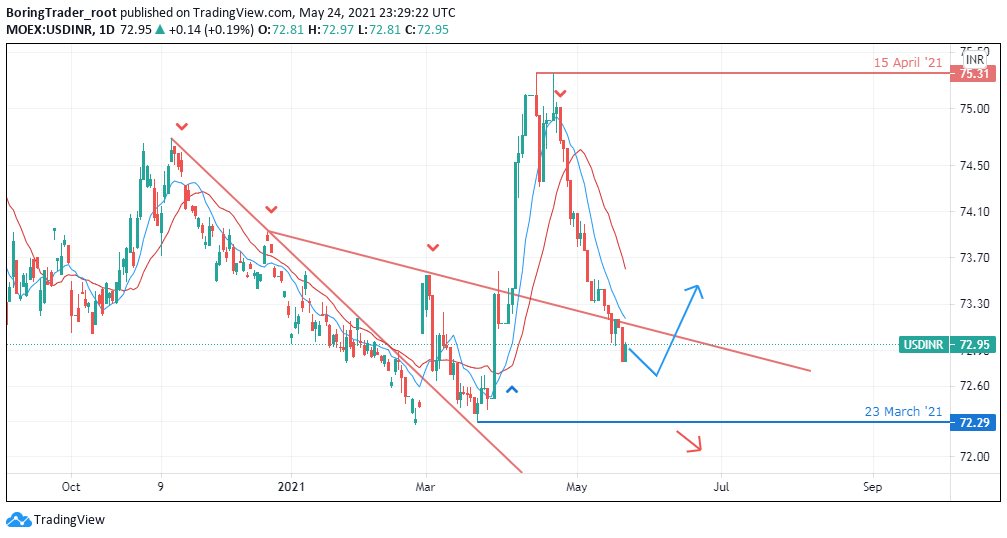
Daily Projections: Breakout of Descending Triangle

Daily Resistance Levels: 74.00, 75.00, 75.31
Daily Support Levels: 72.60, 72.29
Looking at the Daily chart on the forex platform, we can see that the trend is bearish as the bulls’ surge was rejected by the Bears from the resistance zone of 75.31 and its run is aiming for the low of 72.29 where the bullish rally started from.
The Indian rupee is strong at the time of the report. We expect the bulls to react as the pair approaches a psychological zone for either a breakout below or a bounce off the zone.
Bullish Scenario:
We may see a bullish scenario on the daily chart as we expect the Bulls to repeal the sellers from the 72.29 zones if the price cannot close below the level.
Bearish Scenario:
The bears are still dominating the market and they need to take out the nearest low for them to continue their dominance or they lose momentum in the market for a reversal from the support levels.
Conclusion and Projection
The emerging-market are have erased out some gains of the major in recent time having pushed the pair down from the high of 75.798 on the weekly time frame looking at the forex platform.
We expect the bearish trend to continue if the bears can close below the support level of 72.276.
If the Bears should lose momentum during the week, the Bulls will probably push the price towards the resistance level on the weekly chart.

No Comments found