USD/INR – Weekly Outlook ( December 21 2018 )
USD / INR : Weekly Technical Analysis for Bank Of India
Introduction
Last month, a bullish false break pattern was triggered after the Indian Rupee had suffered heavy bashing from the USD. This represents a possible strength recovery of the INR, as the share price of the Bank of India also shows signs of a reversal of the short selling bearish trend.
India’s Fundamentals
Bank Loan Growth
The Reserve Bank of India released the Bank Loans today December 21, as a measure of the lending by local financial systems. The actual result (15.1%) came out equal to the previous reading (15.1%) and therefore considered to as a bearish for the Indian Rupee.
FX Reserves, USD
The actual result ($393.12B) of the FX Reserve released by the Reserve Bank of India came out lower than the previous ($393.73B). This indicates a negative outlook for the INR.
United States Fundamentals
GDP Price Index (Q3)
This is a high impact fundamental announcement which gauges changes in the price of goods and services as an inflationary indicator. The actual results came out 0.1% higher than the previous which was at 1.4%.
After a breakout above the zero level, the U.S GDP ranges above the level indicating a sustainable economy.
Bank of India Weekly Charts

The exchange rates of the Bank of India enters into a series of alternating bullish and bearish divergence from14 May, till 29 October ‘18. The last phase of the divergence pattern is a breakdown of a double bearish accumulation pattern triggered on 26 November. Price quickly triggers a false break leading to a final trend reversal of the share price of the Bank of India. The consecutive bullish divergence indicates an exhausted bearish trend and a possible change in trend.
Bank of India 2-Hour Charts
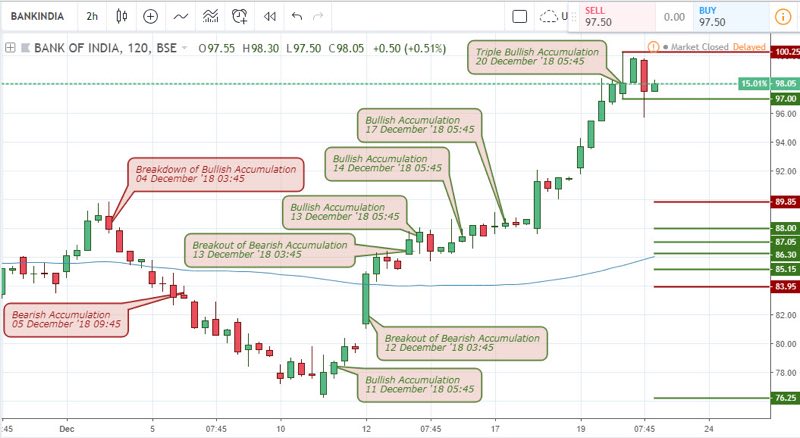
Zooming closer from the 2hour time frame, we observe a breakdown of bullish accumulation on 04 December that got price into a series of consecutive bearish closing candles and consequently a bearish trend.
After the 13% price drop from the breakdown of bullish accumulation, an opposite breakout of bearish accumulation in combination with a bullish accumulation pattern shoots price into an opposite bullish trend that culminates into 28% gain.
Technical Analysis
USDINR Monthly Chart
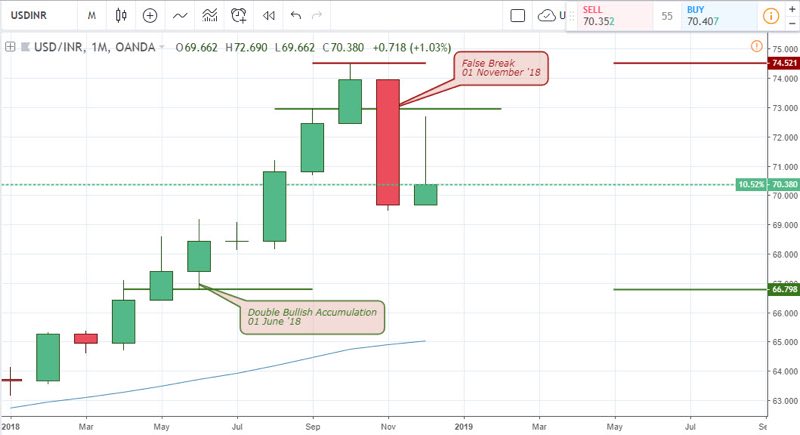
Starting from 01 June ’18, the USDINR triggered a double bullish accumulation pattern that got the pair sailing away from the MA-65. From the above monthly chart, the pair has been in consecutive bearish closing candles for 10 months. The false break confirmed by the bearish closing candle on 01 November confirmed a possible trend reversal and consequently a recovery of the Indian economy.
USDINR: Weekly Chart
The above weekly chart shows a more granular version of the monthly char, highlighting the bearish accumulation pattern on 05 November ’18 and false break pattern on 03 December ’18. Critical resistance levels are 74.011 and 72.904, while critical support levels are 72.098 which have failed into a resistance, and 69.480.
USDINR Daily Chart
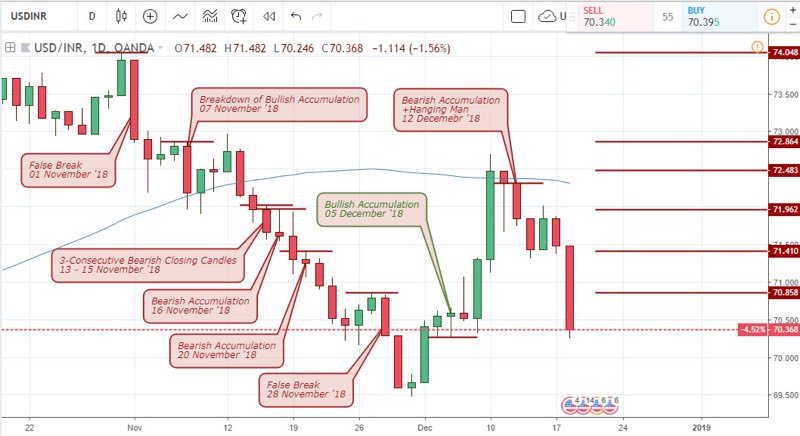
A false break on 01 November which initialized the bearish trend that resulted in a 4.5% decline of the USDINR. An attempt towards a bullish recovery by the bulls fell flat to a breakdown of bullish accumulation on 07 November ’18, thereby leaving a strong resistance behind at 72.864. From that point forward, price plummets by 3.6% making triggering 3-consecutive bearish closing bars, and later a series of bearish accumulation pattern on 16 and 20 November.
The Bearish trend ended and confirmed by a bullish accumulation pattern triggered on 05 December ’18. An opposite bearish accumulation pattern formed around the MA-65 resistance led to price move in the opposite direction by 3.25%.
USDINR 4-Hour (H4) Chart
Just like the famous butterfly effect, a bullish accumulation pattern triggered on 30 November ignites a bullish trend, leaving behind strong bullish support at 69.614, as price makes a 4.3% bullish rally.
The formation of a triple bullish accumulation pattern on 05 December established higher support at 70.475. Another bullish accumulation pattern was again formed on 07 December ’18, and a final bullish accumulation that failed to a breakdown pattern on 11 December ’18 06:00.
The bearish trend of the USDINR left critical resistance levels at 72.691, 72.103, 72.019, and 71.504 respectively, as the breakdown of bullish accumulation patterns, and bearish accumulation patterns are triggered, leading to a 4.1% price drop.
USDINR 2HR Chart
The Indian Rupee enters a battle of dominance as the USDINR oscillates from swing high to swing lows triggering breakout and breakdown patterns on 05 December and 17 December respectively. Critical Resistance levels are established at 113.711, 113.676, 113.521, 113.241, 113.154, and 112.845.
Conclusion and Projection
Formation of alternating false break patterns are presenting swing trading opportunities and a buildup of a bullish regular divergence on the daily chart may initialize a fresh swing high of the USDINR. A golden cross of the MACD oscillator or a high probability bullish reversal price action pattern will confirm the divergence.
USDINR Daily Chart: Anticipating Bullish Divergence
Top 3 India Forex Brokers to trade Indian Rupee.


No Comments found