USDINR – Weekly Outlook & Analysis for 11th July 2021
USDINR Forecast & Technical Analysis for Forex
Introduction
The India forex platform has seen volatility in the market in recent weeks as momentum returns to the major currency in the market. Another Fed meeting is expected to hold during the week and the outcome will determine the next direction for the emerging economy (Indian Rupee).
India’s Fundamentals
Compared to other Asian nations such as Taiwan and Singapore, India gets more hit from the COVID-19 pandemic, consequently leading to a weakening of the Indian Rupee.
In a way to reduce the infection rate, governments in Asia are now forced to place tighter restrictions on movement within the continent.
US Fundamentals
Jobless claims:
The initial claim measures the number of people who officially apply for insurance as unemployed for the first time within the past week. Its outcome is important for the decision-makers who steer the country’s monetary policy because they pay high attention to data in relation to the labor market and consumers spending.
An actual lower than the forecast is good for the US dollar while an outcome higher than the forecast is not suitable for the U.S currency.
The previous data was 364K while the forecast is 345K
USDINR Technical Analysis
Monthly Chart Projection: Trades within correction area

Monthly Resistance Levels: 76.36, 75.56, 77.00
Monthly Support Levels: 72.00,
The previous month ended with strong bullish momentum after it bounces from the low of 72.00. A close above the 75.56 levels of resistance will expose the 76.36 and 77.00 resistance levels for either a breakout above the zone or for a retest and rejection of price around the zones.
The Indian Rupee has not its gains against the U.S dollar since the Feds report of last month. The lockdowns in Asia are not helping the currency in the financial market because of the recent spike on the number of infected people.
An uptrend building up as was analyzed on the previous report as the stochastic indicator was in an oversold region for a possible bullish surge towards the resistance of 74.950. The price of the USDINR pair closed above the previous month’s resistance level will take the price of the USDINR pair up to the next resistance level of 77.00.
Weekly Chart

Weekly Resistance Levels: 75.5798, 76.330
Weekly Support Levels: 72.276, 72.31
The support levels of 72.276 and 72.31 held and gave a double bottom chart pattern for the USDIFT pair for an uptrend move. The long position traders have pushed the pair up towards the 75.798 zones, a breakout of the zone will take the price higher to the high of 2020 (77.416). The trend is a bullish bias for the pair on the weekly timeframe having seen the Indian rupee lose momentum against the US dollar.
Daily Projections: Breakout of Descending Triangle
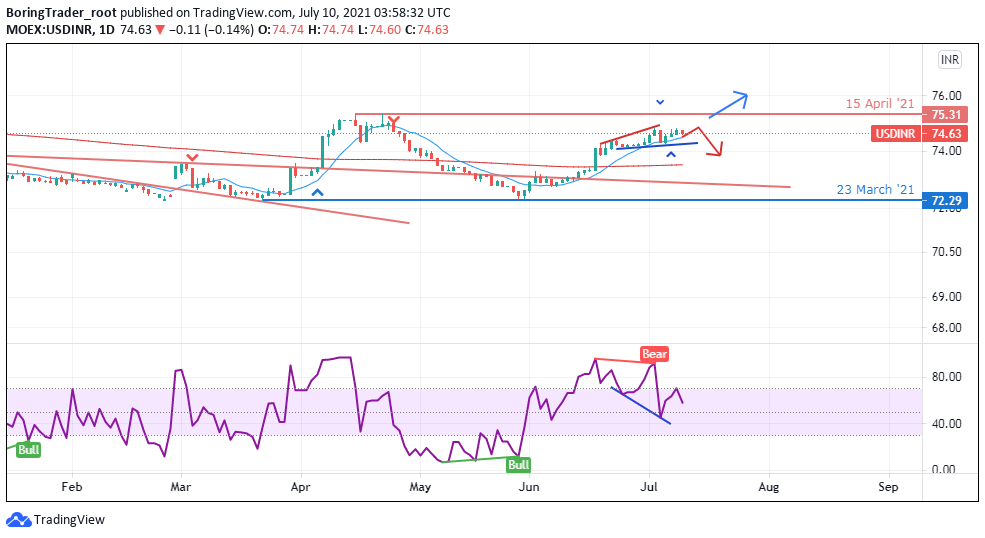
Daily Resistance Levels: 75.005, 75.31, 75.51
Daily Support Levels: 74.00, 74.54, 74.26
Bullish pressure forms an expanding triangle while approaching the 75.31 resistance.
We start to notice a slowing in buy pressure within the current 75.31 and 74.63 price zone and the exchange rate could slump if the bulls fail to breach the 75.31 resistance level.
Bullish Scenario:
The Daily chart is bullish for the USDIFT pair as we expect the trading week is to continue its bullish rally despite the poor out of the US data of last week. We can see that the Bulls still have strength having broken out from the trend line on the daily high for an upward trend.
Bearish Scenario:
Now that the price is approaching the 75.51 zones Bears will start watching out for reversal patterns if they occur for a sell option before they can take action base on the market sentiment when the price reaches the zone.
Conclusion and Projection
The trading week is a bullish beginning for the long position online brokers, as most traders expect a favorable outcome from the Feds meeting this week. The US dollar may continue to get stronger if the expectations about the Fed’s asset purchase and hike rate commences very soon.
A close above the 75.50 zones will open the door for long position traders to buy the pair, but a failure to close above will lead to a correction of the pair.

No Comments found