USDINR – Weekly Outlook & Analysis for August 26 2020
USDINR Forecast & Technical Analysis for Forex
Introduction
The OlympTrade platform sees a sign of recovery for the Indian rupee after being weak since the beginning of the year.
Let us look into the charts for better analysis.
India’s Fundamentals
The improvement in the US-China trade war negotiation and the news of the COVID-19 potential treatment vaccine boost the growing economy and the Asian continent.
The Indian central bank intervention stimulus may be on a halt. It may put online brokers and investors to trade with caution because of the uncertainties in the air during the coronavirus crisis.
U.S. Fundamentals
Core Durable Goods Orders m/m
News released by the Census Bureau focused on the manufacturers’ new orders placed by clients for new durable goods. The customers’ orders do not include any form of transportation items during documentation.
When actual data released is higher than the forecasted data, it is bullish for the U.S. dollar, and up it will go, but if it is bad data, it means that the actual is lower than forecast and the U.S. dollar will be bearish.
The forecast is 1.7% while the previous data released was 3.6%.
USDINR Technical Analysis
USDINR Long term Projection: Range-Bound
Monthly Chart

Monthly Resistance Levels: 77.0080, 74.9450
Monthly Support Levels: 68.3075, 63.2500, 66.8113
The bullish run from 01 January 2018 corrected another swing from 66.8113, and 8.3075 supports pushed the price high to the resistance of 77.0080 and 74.9450 levels as a result of useful economic data from the U.S.
The USDINR may be in another corrective stage since the trend has lost its momentum for three months with the candles closing in a Doji.
A breakdown of bullish accumulation will bring more sellers into the market in the coming weeks for a correction on the USDINR pair.
Weekly Chart

Weekly Resistance Levels: 74.846, 75.000, 77.416, 77.000, 76.330
Weekly Support Levels: 70.443, 72.066, 73.832, 74.846
The resistance level of 76.330 (15 June 2020) created a double top for USDINR pair after the rejection of price to give the Bears an edged in the market to push the price to the low of 74.846.
From the weekly chart, we can see that the USDINR has had low volatility in the past five weeks of trading.
The USDINR price ranges is trapped between resistance high 75.000 and the support zones of 74.846 at the time of the report.
For the new week to come, we may see a bounce to the upside if the news from the U.S. economy will be favorable to the currency.
A close below 74.846 will likely give the Indian rupee strength against the U.S. dollar by pushing down the price to the low of 72.066.
USDINR Medium Term Projections: Bullish Correcting
Daily Chart

Daily Resistance Levels: 78.000, 77.416, 75.100, 76.330
Daily Support Levels: 71.857, 73.450, 74.360
Looking at the daily chart time frame, you can see that the USDINR pair form a descending triangle chart pattern. If the bear’s rally sustained over time, we might see the bearish trend close below the support levels of 73.450 and 74.360 to expose the lower low of 71.857.
However, if the bulls can control the support levels and are ready to break out above the 75.100 resistance zone, we may see the price rise to 76.330.
4HR Chart- Range-Bound
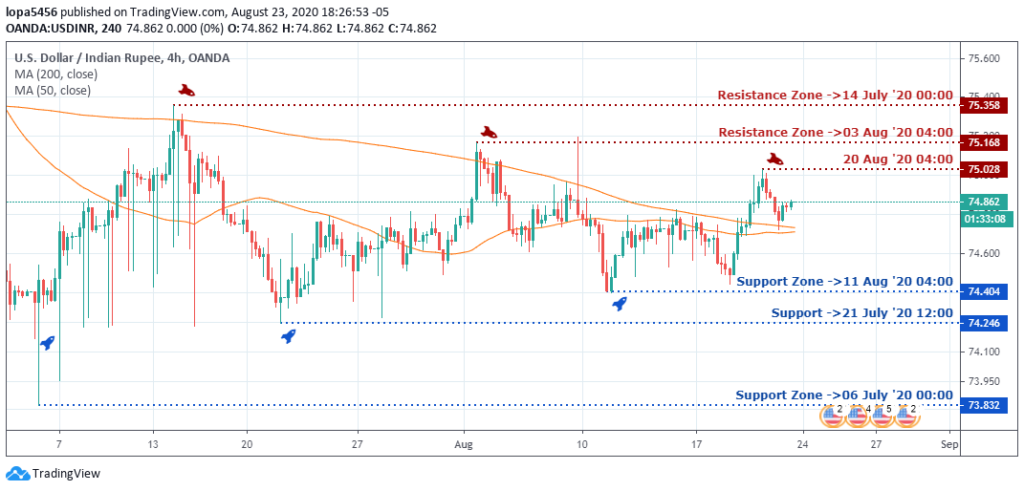
4Hour Resistance Levels: 76.198, 75.358, 75,168
4Hour Support Levels: 73.832, 74.324
On the Hour 4 time frame, we can see that the highs are getting lower while the lows are also getting higher; this is a symmetrical triangle chart pattern that has formed.
There shall be a breakout to either side of the triangle; therefore, the online brokers can wait for a confirmed breakout and a directional bias.
If we get a breakout to the upside, we expect the bulls to ride the trend. If we get a break out to the downside, we hope the bears have the direction.
Bullish Scenario:
From the four hours’ time frame, we can only wait to confirm the trend before we can ascertain the direction bias. However, on the daily chart time frame, we can see that the support zones have been holding.
A bullish scenario may happen based on the daily time frame should the support zone of 74.360 be respected, and the bulls can rally the price higher.
Bearish Scenario:
From the weekly and daily chart time frames, we can see that the Indian rupee has been strong against the USA currency since the U.S. economy has not been stable for some time.
We expected the weekly chart to continue their downward movements if the price can close lower than the 74.846 levels for a continuation of the trend.
Conclusion and Projection
The Indian rupee has not been strong in itself due to the COVID-19 pandemic effects of the economy and the recovery process that is slow for some countries and challenging for the most growing economy.

No Comments found