USD/INR – Weekly Outlook & Analysis for 23rd October 2020
USD/INR Forecast & Technical Analysis for Forex
Introduction
Since August’s previous bearish close, the USDINR pair has not been trending for a while, looking at the IQOption platform. We may see the USDINR pair reacts to the upcoming U.S. presidential election.
India’s Fundamentals
The report from India’s wholesale price showed an increase of 1.32% earlier in September 2020 compared to that of last year and an excellent annual rise in prices. Since February, this is the most robust recovery pace since the Indian rupee continues to recover from the coronavirus pandemic.
The prices increase faster for food articles by 8.17% and manufacture products by 1.61% as of September.
U.S. Fundamentals
The C.B. Index
If the result is higher than the forecast, it will boost the U.S. economy, while lower data will mean a bearish trend for the currency.
CB leading Index m/m
The Forecast data is 0.8% while the previous 1.2%.
USDINR Technical Analysis
USDINR Long term Projection: Range-Bound
Monthly Chart

Monthly Resistance Levels: 74.653, 76.330
Monthly Support Levels: 69.970, 68.123, 64.126, 63.160
The Indian rupee had not advanced much liked it did in August. Could it be that the bulls are pushing back the bears or resting to gain another bearish momentum to continue its downwards move?
However, the resistance zones of 74.653 and 76.330 must be taking out for the bulls to continue their trend.
We expect the bullish trend correction to continue down to the support levels of 69.970 in the nearest future from the forex platform.
Weekly Chart

Weekly Resistance Levels: 74.612, 75.496, 76.822
Weekly Support Levels: 70.346, 71.744, 72.658
The online brokers can see a beautiful downtrend on the weekly chart, which started from the high of 7.822 as of April 2020; the USDINR pair has lower highs and lower lows, indicating a downtrend.
We may see the U.S. dollar rise against the Indian rupee with the indicator showing sign of oversold for a possible rise in price for the new week. The previous week closed with a railway track pattern, which will likely attract long position traders.
If the buyers move can take the price above the resistance levels of 75.496, we shall see the 76.822 level exposed, bringing the bearish trend to an end. However, the bearish trend may continue if they can take-over the market from the 74.612 zones to close below the 73.252 levels.
USDINR Medium Term Projections: Bullish Correcting
Daily Chart

Daily Resistance Levels: 74.228, 74.038, 75.358.75.794
Daily Support Levels: 71.472, 72.658
The daily chart shows intense resistance levels where the sellers took over the market with strong engulfing candles establishing a downtrend pushing the prices down to the 72.658 levels before the bulls reacted.
However, 74.228 levels are a psychological zone for the bulls to build momentum if they can turn that level around to their advantage for a rally to the resistance zone of 75.794.
If the psychological level should reject the bull’s advancement, the bears can push the price down to the 72.658 level and lower.
USDINR 4HR Chart- Range Bound
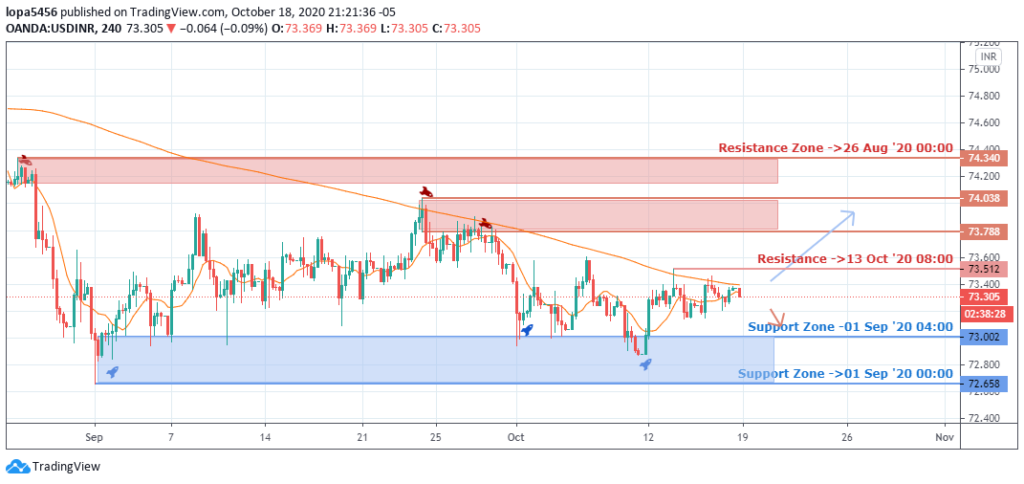
4Hour Resistance Levels: 74.340, 74.038, 73.788, 73.512
4Hour Support Levels: 73.002, 72.658
We can see a ranging chart for USDINR pair between the 74.340 and 72.658 levels, having seen that the price has respected those levels.
A break above will likely take the price higher, while a possible break lower will mean that USDINR will move lower, and the Indian rupee will gain against the U.S. dollar.
Bullish Scenario:
A possible bullish scenario based on the daily time frame may happen if the Bulls momentum buildup at the support level of 72.658 can close above the resistance level of 74.228.
Bearish Scenario:
A general bearish scenario based on the weekly time frame may continue if they use the resistance level of 74.612 to rejects the bulls’ buildup around the zones.
Conclusion and Projection
The Indian rupee maintains a solid position against the Greenback as the USDINR remains in a bearish trend. We anticipate a continuation of the bearish trend in the long term. However, traders can look out for short term scalps to the upside.

No Comments found