USD/INR – Weekly Outlook for May 31 2019
USD to INR Forecast & Technical Analysis
Introduction
A decline in India’s quarterly GDP shows the weakness of the Indian Rupee on IQ Option platforms after the USDINR pair exited an overbought area from a monthly time frame.
Let’s take a closer look at the price dynamics and how the pair tapper off the price decline.
India’s Fundamentals
India FX Reserves in USD
India’s Quarterly Gross Domestic Product Quarterly
India’s Ministry of Statistics published the readings for the nations GDP, which measures the entire value of produced goods and services.
The macro indicator (GDP) shows the health of the Indian economy from a broad spectrum.
The actual reading came out at 5.8%, a value less than the previous reading (6.6%) and considered to carry a negative outlook on the Indian Rupee.
United States Fundamentals
US Core Personal Consumption Expenditure
Readings from the US Bureau of Economic Analysis, shows the actual reading at 1.6%, value the same as the last reading. The fundamental indicator shows an average of money spent by consumers within a period of one month. By the term (core), food and energy which are seasonally volatile are not included in the calculation, as the indicator helps gauge inflation.
Technical Analysis
USDINR: Weekly Chart

As shown on the above weekly chart of the USD to INR currency pair, the pair maintains deep oscillatory cycles, that’s excellent for swing trading. The monthly charts show a long term quarterly trend that suits positional traders.
USDINR Daily Chart

The above daily chart reveals the activities of swing traders, as they ride the waves of the USD to INR pair like a rollercoaster. Starting with a price close above a bullish inside bar on May 07 2019, that led to a 2.01% price increase, the pair signaled an opposing breakdown of the bearish inside bar.
The price decline from the bearish inside bar signaled an increase in supply on May 24 ’19. Considering that the selling pressure was indicated towards the base of a bearish swing, we should look forward to a polarity switch, as the pair closes above 69.752 resistance May 29 ‘19.
USDINR 4HR Chart
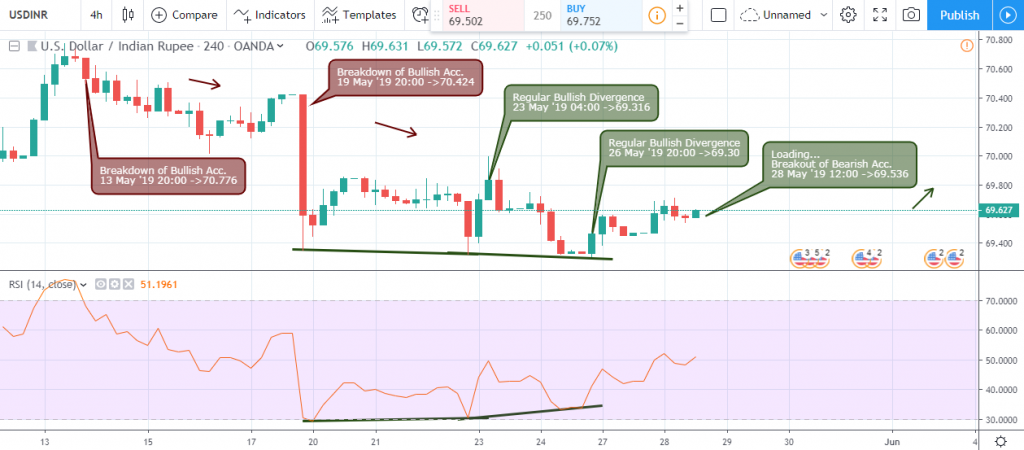
Clues towards a rejection of the bearish accumulation setup were signaled by a series of regular bearish divergence on the 4hour time frame.
These divergence setups were flagged on May 23, and 26 with support at 69.316, and 69.30 respectively. The analyzed breakout of bearish accumulation on May 28 ’19 12:00 resulted in a price increase of about 0.5%, before signaling an opposite failure of bearish accumulation on May 29, 2019, 16:00.
Conclusion and Projection
As we come to the end of the month, if the current month close bullish, and the weekly chart support level of 68.602 holds, then we should look out for swing trading opportunities on the daily and 4hour charts towards the upside. However, a bearish price close of the RSI overbought level on the monthly chart shows that the pair may remain within a bearish range following a collapse of the overbought area (Monthly Chart).

No Comments found